• Home
  • Forums
  • Trades
  • News
  • Calendar
  • Market
  • Brokers
  • Login
  • Join
  • User/Email: Password:
  • 7:11am
Menu
  • Forums
  • Trades
  • News
  • Calendar
  • Market
  • Brokers
  • Login
  • Join
  • 7:11am
Sister Sites
  • Metals Mine
  • Energy EXCH
  • Crypto Craft

Options

Bookmark Thread

First Page First Unread Last Page Last Post

Printable Version

Similar Threads

Trading is this Simple? Finally Explained simple and clearly! 39 replies

Trade Naked Candlesticks strategy 15 replies

Naked price trades 11 replies

Trading naked or keep it simple stuff.... 20 replies

SIMPLE EA for a simple method needed!! 1 reply

  • Interactive Trading
  • /
  • Reply to Thread
  • Subscribe

Nearly Naked (Simple Trades)

  • Last Post
  •  
  • Page 1 23456 591
  • Page 1 2 591
  •  
  • Post #1
  • Quote
  • First Post: Edited at 2:05am Apr 9, 2010 12:54am | Edited at 2:05am
  •  Saxon
  • Joined Jan 2010 | Status: My Coffee is Cold :( | 3,632 Posts
I am starting this thread for people, and if no one else, me, to post their setups for any pair on any time-frame. I would like to keep as many indicators out of it as possible. As you will find, everyone has their own spin on an indicator, which doesn't help the group much. For this thread, I would like to keep it to MAs (Simple, Exponential, etc...), S/R lines, Momentum, PA Analysis (Candles, Bar, TL, Shapes, etc...). You get the idea. So if you feel you have to explain the indicators or what not on your chart, you should probably not post it. One word on indicators and I won't argue it anymore. As you will find, there are 10s of thousands of indicators out there, all with their own tweak. But there is one thing that ALL investors look at, no matter you status (Institutional, Private, etc...); Price Action. You can be sure that if you see an obvious S/R line, then most likely 90% of ALL traders out there see it. The more people that see it, the more people act on it. You can have your indicator, with your own personal tweak to it, but chances are, not many people are looking at the same thing. You get the idea. (I am not taking a shot at indicators, I use them too.)
Also, this thread needs to be positive. I don't care how seasoned you are, please no bullying. There are no dumb questions and feel free to post them. If you feel like you need to throw in an indicator or two, no worries. The general theme is just as few indicators as possible and a lot of S/R. Also, please list out your trades in detail as I will show on my first post. Giving scenario analysis helps too, as you will also see on my first post. If no one posts on this, no worries, it will just become my trade journal.
  • Post #2
  • Quote
  • Apr 9, 2010 1:10am Apr 9, 2010 1:10am
  •  Saxon
  • Joined Jan 2010 | Status: My Coffee is Cold :( | 3,632 Posts
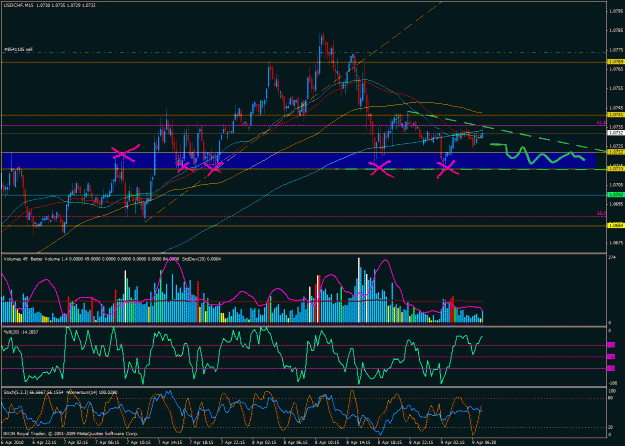
I am typing this not on my trading terminal so I will post the graphs after I type. In the first chart, you will see a possible CHF M15 triangle. One issue as many of you will probably be aware, this descending triangle is on a H1 uptrend. So do not rely heavily on it. There are significant S/R that have created a blue zone on my chart. The upper S/R of the blue zone is significant to rising prices and the lower S/R is significant to falling prices as you can see with the pink X's. Please also be aware of volumes and momentum as PA reaches the lower bound of the blue zone. It has been tested and could potentially break. If it does, the price could fall to 1.0700 which is a "00". In my history "00"s usually cause a bounce or speed up the PA, so be careful around "00". This could cause a bounce to upper bound of blue zone so set stops accordingly. If PA makes it past "00", then the next S/R is 50 Fib. As you can see prices have reacted to this level in the past. This trade could potentially net 13-25 pips depending on the hurdles (S/R). MA is in and above PA so not to cause too much downside friction. Could cause "rubber band" if PA gets too far away though. At 13 pips, I would take half positions and set Stops to BE or trail.

On the second chart, this is also a representation of potential price movements. I would like a combo of white and yellow. PA might invalidate Triangle as I am typing this and could move to red arrows. We shall see.

Also, make sure that YOUR analysis agrees before making any trade. These are just what I am seeing, please be confident in your own decisions.
1
  • Post #3
  • Quote
  • Apr 9, 2010 1:11am Apr 9, 2010 1:11am
  •  Saxon
  • Joined Jan 2010 | Status: My Coffee is Cold :( | 3,632 Posts
Here they are
Attached Images (click to enlarge)
Click to Enlarge

Name: chf2.gif
Size: 52 KB Click to Enlarge

Name: chf1.gif
Size: 50 KB
1
  • Post #4
  • Quote
  • Apr 9, 2010 1:14am Apr 9, 2010 1:14am
  •  Geppyg
  • | Commercial Member | Joined Mar 2009 | 1,421 Posts
Hi saxon,

I wish you good luck with your new thread..in order for newbies. I would humbly request you to trade print ie trade sl tp

There are many threads that have similar setups but I guess they concentrate on specific pairs.

Well Done for putting the effort in

GeppyG
600 Pips a Month with Shahab and GeppyG Happy Trading Everybody....:D
  • Post #5
  • Quote
  • Apr 9, 2010 1:18am Apr 9, 2010 1:18am
  •  Saxon
  • Joined Jan 2010 | Status: My Coffee is Cold :( | 3,632 Posts
Hey Geppy, is there a thread out there that you can post any pair on? I just get in trouble on the other threads for posting my non-associated pairs. I just wanted a thread that used simple stuff that everyone can understand and any pair was welcome. I think a saw one a while back but people stopped posting to it. If anyone knows of any I/we can just move there and I can just close this one down?
  • Post #6
  • Quote
  • Apr 9, 2010 1:22am Apr 9, 2010 1:22am
  •  Geppyg
  • | Commercial Member | Joined Mar 2009 | 1,421 Posts
Quoting Saxon
Disliked
Hey Geppy, is there a thread out there that you can post any pair on? I just get in trouble on the other threads for posting my non-associated pairs. I just wanted a thread that used simple stuff that everyone can understand and any pair was welcome. I think a saw one a while back but people stopped posting to it. If anyone knows of any I/we can just move there and I can just close this one down?
Ignored
Dont Worry about it mate....
Carry on we will try and keep this thread alive....
Trade Setup and Pip count could give the thread a lot more intrest as well.
I shall start some posting as well...

Take care
GeppyG
600 Pips a Month with Shahab and GeppyG Happy Trading Everybody....:D
  • Post #7
  • Quote
  • Apr 9, 2010 1:26am Apr 9, 2010 1:26am
  •  Saxon
  • Joined Jan 2010 | Status: My Coffee is Cold :( | 3,632 Posts
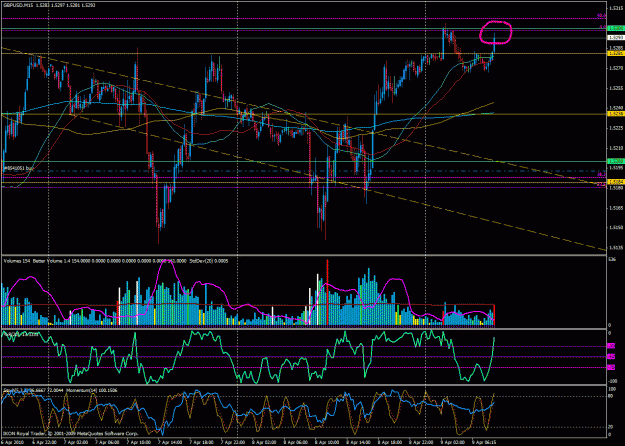
Here is my rundown on GBP, see chart below.

PA broke 1.5281 which was a very significant S/R. PA did reach "00" 1.5300 and reversed direction. On 4/8 PA again broker through upper chan and MAs but we all know why. You can see my S/R listed on the graph. I have no scenarios yet as I am still running charts right now. I think while I am typing this chf got pushed ot 1.0741 and MA100, we'll see how it holds. PA has been choppy so S/R is not as easy to come by. On M15, I rely heavily on MA100. I also prefer simple MAs.

IF GBP does decide to fall, LT MAs are first friction, followed by 1.5236. That is my view
  • Post #8
  • Quote
  • Apr 9, 2010 1:28am Apr 9, 2010 1:28am
  •  Saxon
  • Joined Jan 2010 | Status: My Coffee is Cold :( | 3,632 Posts
Here is my GBP
Attached Image (click to enlarge)
Click to Enlarge

Name: gbp.gif
Size: 56 KB
  • Post #9
  • Quote
  • Apr 9, 2010 1:34am Apr 9, 2010 1:34am
  •  Saxon
  • Joined Jan 2010 | Status: My Coffee is Cold :( | 3,632 Posts
Here is my JPY which may be at setup now.

93.63 is significant S/R. Watch price formation and testing as MAs are holding bottom. As you will also see, there is a "blue zone" with upper and lower S/R bounds for this as well. Upper has been tested twice in the last few hours. I did get caught on a GBP trade when a triangle formed and moved PA against me, so watch all time frames for price formations. Watch this as it unfolds and direction is decided. I will post me setups and scenarios soon.
  • Post #10
  • Quote
  • Apr 9, 2010 1:35am Apr 9, 2010 1:35am
  •  Saxon
  • Joined Jan 2010 | Status: My Coffee is Cold :( | 3,632 Posts
JPY
Attached Image (click to enlarge)
Click to Enlarge

Name: jpyy.gif
Size: 46 KB
  • Post #11
  • Quote
  • Apr 9, 2010 1:41am Apr 9, 2010 1:41am
  •  Saxon
  • Joined Jan 2010 | Status: My Coffee is Cold :( | 3,632 Posts
Here is a cleaner view of that JPY situation.
Attached Image (click to enlarge)
Click to Enlarge

Name: j.gif
Size: 15 KB
  • Post #12
  • Quote
  • Apr 9, 2010 1:55am Apr 9, 2010 1:55am
  •  Saxon
  • Joined Jan 2010 | Status: My Coffee is Cold :( | 3,632 Posts
GBP,
GBP is back at 1.5281. PA around this line has always been interesting. See the triangle that got me before (Pink)
  • Post #13
  • Quote
  • Apr 9, 2010 1:56am Apr 9, 2010 1:56am
  •  Saxon
  • Joined Jan 2010 | Status: My Coffee is Cold :( | 3,632 Posts
GBP
Attached Image (click to enlarge)
Click to Enlarge

Name: gb.gif
Size: 54 KB
1
  • Post #14
  • Quote
  • Apr 9, 2010 2:06am Apr 9, 2010 2:06am
  •  Saxon
  • Joined Jan 2010 | Status: My Coffee is Cold :( | 3,632 Posts
Quoting Saxon
Disliked
Here they are
Ignored
Looks like CHF is following Pink scenario and now entering the blue zone.
  • Post #15
  • Quote
  • Apr 9, 2010 2:09am Apr 9, 2010 2:09am
  •  Saxon
  • Joined Jan 2010 | Status: My Coffee is Cold :( | 3,632 Posts
Quoting Saxon
Disliked
GBP,
GBP is back at 1.5281. PA around this line has always been interesting. See the triangle that got me before (Pink)
Ignored
GBP

If it bounces I will take quick short for small pips.
Attached Image (click to enlarge)
Click to Enlarge

Name: gb22.gif
Size: 52 KB
  • Post #16
  • Quote
  • Apr 9, 2010 2:13am Apr 9, 2010 2:13am
  •  Saxon
  • Joined Jan 2010 | Status: My Coffee is Cold :( | 3,632 Posts
CHF

CHF dipped in blue zone
Attached Image (click to enlarge)
Click to Enlarge

Name: chf blue.gif
Size: 48 KB
  • Post #17
  • Quote
  • Apr 9, 2010 2:15am Apr 9, 2010 2:15am
  •  OvT
  • | Joined Dec 2009 | Status: Member | 411 Posts
Quoting Saxon
Disliked
CHF

CHF dipped in blue zone
Ignored
yep spot on on the pink scenario, that was awesome
looking at G/U now
  • Post #18
  • Quote
  • Apr 9, 2010 2:17am Apr 9, 2010 2:17am
  •  Clouds
  • Joined Apr 2008 | Status: Member | 7,674 Posts
Quoting Saxon
Disliked
Here they are
Ignored
Great thread.. I too see E/U and U/Chf in corrective mode. Daily pin bars.
  • Post #19
  • Quote
  • Apr 9, 2010 2:18am Apr 9, 2010 2:18am
  •  Saxon
  • Joined Jan 2010 | Status: My Coffee is Cold :( | 3,632 Posts
Quoting OvT
Disliked
yep spot on on the pink scenario, that was awesome
looking at G/U now
Ignored
It is decision time for GU. Will she push through? I have my finger on the trigger
  • Post #20
  • Quote
  • Apr 9, 2010 2:20am Apr 9, 2010 2:20am
  •  Saxon
  • Joined Jan 2010 | Status: My Coffee is Cold :( | 3,632 Posts
Quoting Clouds
Disliked
Great thread.. I too see E/U and U/Chf in corrective mode. Daily pin bars.
Ignored
Thanks clouds. I just have many windows up and am trading many pairs. So it was hard to switch between threads to post what I was seeing, so I am just going to throw some up here.

CHF is on the bottom of my blue zone right now, so intersting PA right now. GU is considering the push through on M15
  • Interactive Trading
  • /
  • Nearly Naked (Simple Trades)
  • Reply to Thread
    • Page 1 23456 591
    • Page 1 2 591
0 traders viewing now
  • More
Top of Page
  • Facebook
  • Twitter
About FF
  • Mission
  • Products
  • User Guide
  • Media Kit
  • Blog
  • Contact
FF Products
  • Forums
  • Trades
  • Calendar
  • News
  • Market
  • Brokers
  • Trade Explorer
FF Website
  • Homepage
  • Search
  • Members
  • Report a Bug
Follow FF
  • Facebook
  • Twitter

FF Sister Sites:

  • Metals Mine
  • Energy EXCH
  • Crypto Craft

Forex Factory® is a brand of Fair Economy, Inc.

Terms of Service / ©2021