If Chikou span (CS) is above the candlestick of 26 periods ago, then there is a bullish trend.
If CS is below the candlestick of 26 periods ago, then there is bearish trend.
Ignored
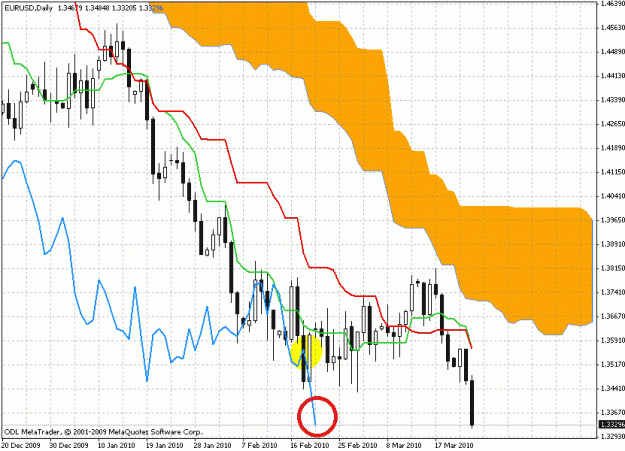
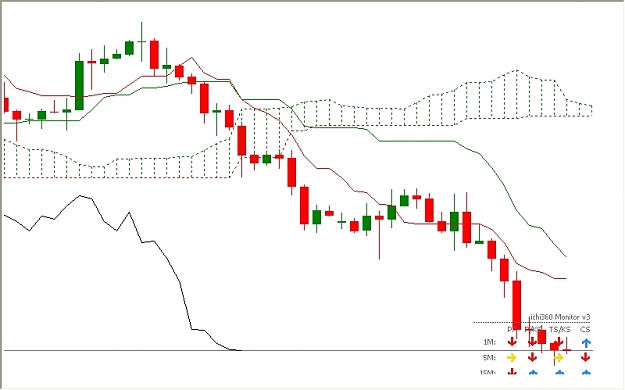
At first thanks for your answer. Both states above are clear to me, but when you consider my chart, then you'll see that ChikouSpan is within that black candle (where the yellow ellispe is). So Chikou is not above nor below the candle?
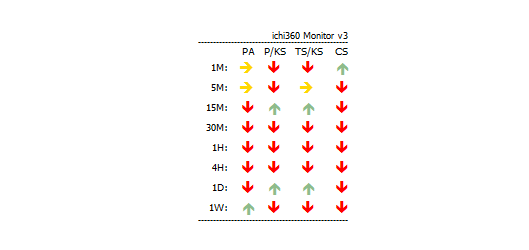
I’ve finished the testing of ichi360 Monitor V3 and its ready for your use now. The only difference between the V2 and this new version is that the V3 also gives a snapshot of lower timeframes up to 1 minute. Hope you will find it useful for your trading.
After I watching that ICHI101 Video I have a question regarding ChikouSpan. The mentor in ICHI101 tells that Chikou can be in three different states:
a) Chikou is above the candle = bullish
b) Chikou is below the candle = bearish
c) Chikou is between the candle = neutral (look in the attachment)
At first thanks for your answer. Both states above are clear to me, but when you consider my chart, then you'll see that ChikouSpan is within that black candle (where the yellow ellispe is). So Chikou is not above nor below the candle?
Ignored
Sorry, may be I was not that clear. Once again, CS is your closing price plotted 26 periods ago. Have a look at the white bullish candle, the third one as you count from right to the left.This candle represents the CS in the body of the black (bear ) candle as you have marked it. As you can see the bottom and top of the white candle is your daily low and high ( your daily range). If you refer to the bear candle, 26 days ago, the price made a lower low and higher high, so daily range was of a bigger scale compared to the one on the day with the bull candle. Therefore, the CS is in the candle.
Hi Nightyhawk I think you misread the chart...your Chikou is in the red circle...; )
Ignored
Imagine you saw that chart just 2 days ago... there Chikou was within that long black candle.... so once again my question - how do we rate the situation, when chikou is not above or below a candlestick but inside that candle?
I’ve finished the testing of ichi360 Monitor V3 and its ready for your use now. The only difference between the V2 and this new version is that the V3 also gives a snapshot of lower timeframes up to 1 minute. Hope you will find it useful for your trading.
I’ve finished the testing of ichi360 Monitor V3 and its ready for your use now. The only difference between the V2 and this new version is that the V3 also gives a snapshot of lower timeframes up to 1 minute. Hope you will find it useful for your trading.
Imagine you saw that chart just 2 days ago... there Chikou was within that long black candle.... so once again my question - how do we rate the situation, when chikou is not above or below a candlestick but inside that candle?
Ignored
Obviously, you can not assess the situation on only one daily candlestick. You know that daily candlestick represents 24 1h candlesticks, 6 4H candlesticks and so on. If you do itraday trading switch to a lower timeframe to see the price action in more detail. If you trade on a daily chart zoom out further, not in 40 candlesticks as in your chart .
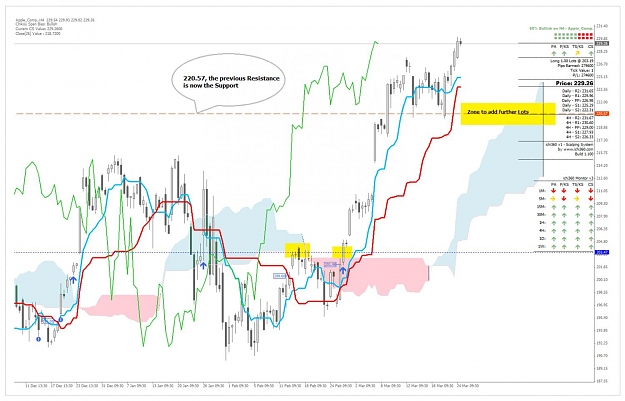
FinallyApple has managed to see the Top of 230$ … I’m expecting some pullback for some time and then add further lots at the 220$ zone which is Resistance turned into Support Zone.
I’ve finished the testing of ichi360 Monitor V3 and its ready for your use now. The only difference between the V2 and this new version is that the V3 also gives a snapshot of lower timeframes up to 1 minute. Hope you will find it useful for your trading.
What do I need to do to use ichi360 indicator? I have a Metetrader4 AlpariUK demo account but I don't know alot about computer's so can I use it on it. Everytime I tried to download it it keep saying I have to search for a program to open it Im confused.
What do I need to do to use ichi360 indicator? I have a Metetrader4 AlpariUK demo account but I don't know alot about computer's so can I use it on it. Everytime I tried to download it it keep saying I have to search for a program to open it Im confused.
Ignored
You need to save it in the indicators folder, not open/run the file
Go to Computer > C Drive > Program files > Metatrader (or name of platform) > experts > indicators.
Once it is in there restart your MT4 and add to your charts. It a custom indicator.