I´m using this system for Scalping in TF 5M. I have added only a filter, the indicator FREEDOMBAR in 60 and I only take the trades in the direcction of the main trend that shows FREEDOMBAR.
In EUR-USD and in the last three days 25 trades only 6 negative. The exits.. when de candle touch a pivot point.
oh¡¡ Sorryyyy is posible that the indicator freedombar needs the indicator Heiken:Ashi_Overlay, I send you now with a picture- If you have a problem... tell me.
You must configure freedombar in timeframe 60. Blue means up trend, red means down trend in 1hr. If freedombar is blue you must take long trades and if freedombar us red.. short trades.
Nice and Simple Strategy Lou!
I'll devote some screen-time to it to get a feel for it. Just eye-balling reveals that best to wait for curve on ALF+ slope on TVI. Also, since you're only doing it on EU M15, just a thought you might consider opening up UC alongside as they are negetively co-related most of the time. Just to add up some pips.
Good trading to you!
Cheers
Ignored
Actually, I switch between TFs frequently to get a sense of the trend (or lack thereof). UC, huh? I'll take a look.
|
Joined May 2006
|
Status: Only one user name...
|1,367 Posts
I've been doing quite a bit of visual backtesting and am now not certain that the curve of ALF in the direction of PA should be an entry requirement.
I'm not ready to back off this completely, but I have said consistently that it is "best" if the curve is present rather than "must". Don't mean to waffle here, but this method is a work in progress...
Also experimenting with settings for TVI to improve its usefulness as an exit signal - 8,8,5 looks promising.
If you have interest in trading this method (and I do believe it has great potential - I have 10 wins, 2 losses in the past two weeks) do a little visual backtest of your own and post your opinions.
I've been doing quite a bit of visual backtesting and am now not certain that the curve of ALF in the direction of PA should be an entry requirement.
I'm not ready to back off this completely, but I have said consistently that it is "best" if the curve is present rather than "must". Don't mean to waffle here, but this method is a work in progress...
Also experimenting with settings for TVI to improve its usefulness as an exit signal - 8,8,5 looks promising.
If you have interest in trading this method (and I do believe it has great potential...
Ignored
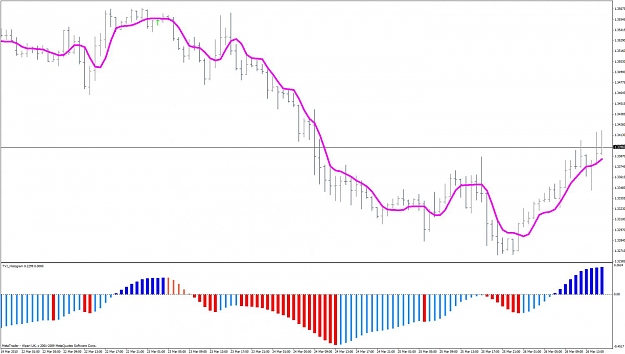
From what I have been watching on the charts over the past week, I think more important than slope of ALF is what TVI is doing on higher timeframes. I like the histogram and have it configured with different colors for positive and negative, increasing and decreasing values. A screenshot is attached for reference. In the chart, dark blue above 0.00 is a strong indication to trade long, dark red below 0.00 is a strong indication to trade short. Light blue and light red are weak indications.
I'm an MTF trader, so this leaves me a bit biased, but looking for entries on M15 I would confirm that TVI on H1 is either pointing in the direction of the entry or at least positive for long entries/negative for short entries. In other words, I wouldn't enter on M15 against a strong signal on H1 in the other direction.
Respecting H1 it then becomes fairly safe to enter on M15 (or M5) when price action relative to ALF and TVI slope/color (regardless of positive or negative value) agree, as originally described here. ALF can probably still be flat at the time of entry. On the chart posted, a strong indication for longs is showing on H1 TVI, so I wouldn't go short no matter what M15/M5 is saying.
From what I have been watching on the charts over the past week, I think more important than slope of ALF is what TVI is doing on higher timeframes. I like the histogram and have it configured with different colors for positive and negative, increasing and decreasing values. A screenshot is attached for reference. In the chart, dark blue above 0.00 is a strong indication to trade long, dark red below 0.00 is a strong indication to trade short. Light blue and light red are weak indications.
I'm an MTF trader, so this leaves me a bit biased, but...
Ignored
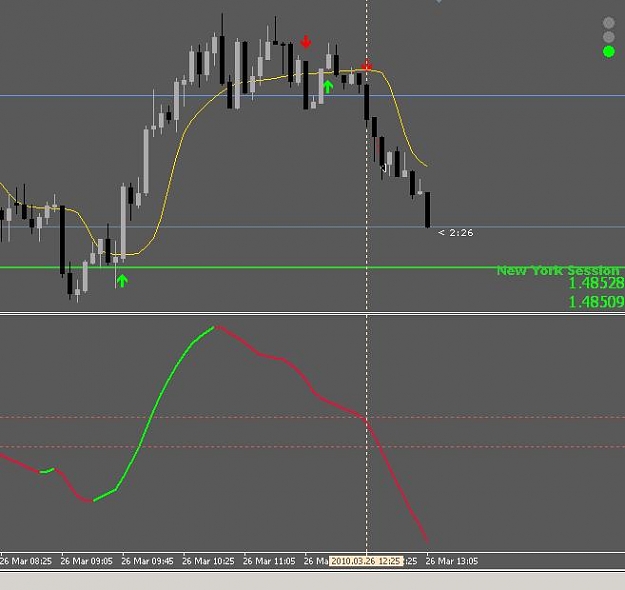
I have noticed the Levels being a factor also, I like to scalp so I have been watching the 5 with just the 15m as confirmation. But just using the TVI 2 color indy, I mark the levels -.15 and +.15. When the TVI passes between(short from above, long from below) with a 15m confirm, well, I'm not missing many of those. Just caught a sweet 15 pipper on the Cable. A RSI of 8 set at 55-45 seems to match this TVI move often.
From what I have been watching on the charts over the past week, I think more important than slope of ALF is what TVI is doing on higher timeframes. I like the histogram and have it configured with different colors for positive and negative, increasing and decreasing values. A screenshot is attached for reference. In the chart, dark blue above 0.00 is a strong indication to trade long, dark red below 0.00 is a strong indication to trade short. Light blue and light red are weak indications.
I'm an MTF trader, so this leaves me a bit biased, but...
Ignored
You trade very much the way I do. I agree completely about the slope of ALF - I've missed good entries by waiting too long. I haven't done much with M5 only because I feel it needs a little more close attention than I'm up to early in the morning
By the way, I really like your color mods to TVI_Histogram.
I have noticed the Levels being a factor also, I like to scalp so I have been watching the 5 with just the 15m as confirmation. But just using the TVI 2 color indy, I mark the levels -.15 and +.15. When the TVI passes between(short from above, long from below) with a 15m confirm, well, I'm not missing many of those. Just caught a sweet 15 pipper on the Cable. A RSI of 8 set at 55-45 seems to match this TVI move often.
Cheers
Ignored
I'm glad to see that someone is able to scalp successfully with this - I found out the hard way that scalping is not the best way for me to trade but I always marvel at the skill of those who can do it well.
Interesting use of levels - I had not thought of using them.
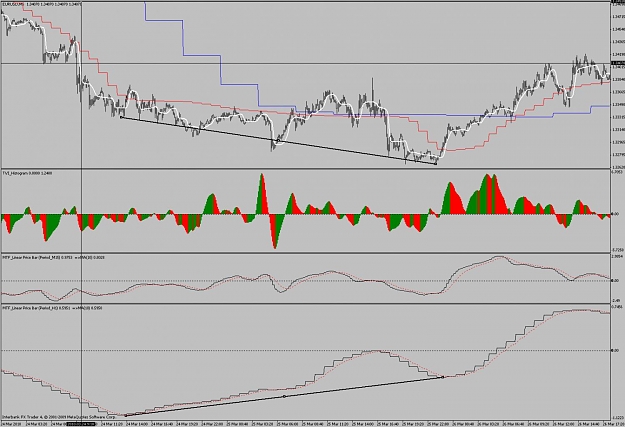
Attached are MTF ALF and TVI indicators. Since the markets are closed, cannot verify them but looks good on charts.
On a M5 chart the ALF _240 is a good trailing stoploss or emergency stoploss while the ALF 60 provides multiple entries in the direction of the trend.
Attached are MTF ALF and TVI indicators. Since the markets are closed, cannot verify them but looks good on charts.
On a M5 chart the ALF _240 is a good trailing stoploss or emergency stoploss while the ALF 60 provides multiple entries in the direction of the trend.
Have not tried it but seems viable.
Ignored
Please illustrate entries, SL etc on the chart. Thanks