I have been trading this method for about a week but it has been in development for several months. It's designed for daytrading (not for scalping or position trading) which is the approach I am most comfortable with.
I have a reputation in certain quarters for being anti-indicator, probably because when I see charts that look like an accident at the fireworks factory, my hair catches fire. I believe that indicators have their place when they are on the chart for a very specific purpose (and the user knows what that purpose is).
Accordingly, this method has only two indicators:
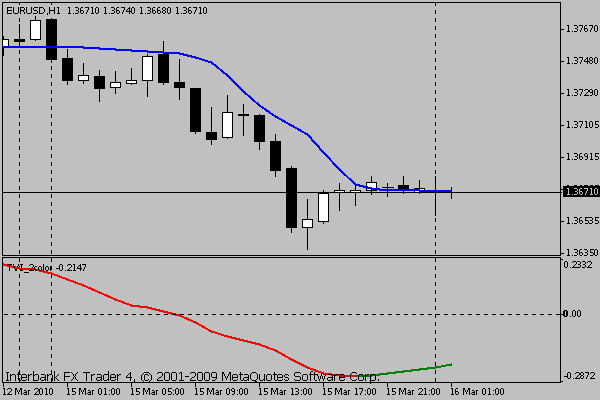
ALF (Adaptive Laguerre Filter) was created by John Ehlers, a true visionary who adapts Digital Signal Processing techniques for use in futures trading. You may want to visit his website at www.mesasoftware.com. In the Technical Papers section of the site are many interesting and free examples of his work. ALF functions as a continuously self-adjusting overbought/oversold line. Buy when price goes above the line, sell when price goes below (similar to a Stochastic except that ALF is both the 20 and the 80).
TVI (Tick Volume Indicator) was introduced by William Blau in his book "Momentum, Direction and Divergence". The book contains many other excellent indicators and delves deeply into smoothing techniques that introduce only minimal lag. TVI measures the relationship between incoming ticks for a given volume. If upticks outnumber downticks the TVI rises, and vice-versa.
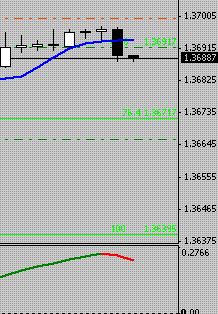
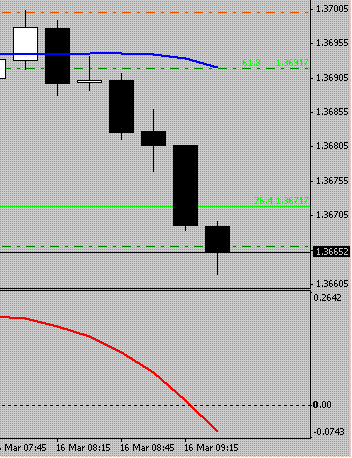
A screenshot and the necessary indicators (plus a template) are attached below.
If you have an hour or so with nothing more pressing to do, set this up on a M15, M30, or H1 EURUSD chart and take a look at the last few weeks of trading. It sounds presumptuous of me to say this, but I sincerely believe that this approach needs very little explanation. Entry and exit points and times when you should not be trading are quite clear.
Download the indicators and template at the bottom of this post. Copy all 4 indicators to the yourmt4/experts/indicators folder and the template to the yourmt4/templates folder - then close and restart MT4.
I'll drop back in tomorrow and, if there appears to be some interest in this method, I will deal with a few of the fine points (and the not-so-fine points).
Update 3/19/10 - A few words about the TVI indicators.
You may use any of the three TVI indicators (but make sure all are in your mt4/experts/indicators folder). Both TVI_2color and TVI_Histogram show the data using 2 colors as a visual aid - the actual data value shown is identical to that of TVI.mq4. Both will repaint the current bar as the data changes (which they should). TVI_2color will also repaint the preceding bar when the direction of the trend changes. This is deliberate and unavoidable - because of the way MT4 paints the chart this is necessary in order to keep the line unbroken. As you learn the method you will see that this is not a problem because TVI nearly always changes direction well before ALF creates a trade signal but if it bothers you, use TVI_Histogram or just TVI by itself.
Update 3/27/10 - A mathematically correct ALF
I mentioned at one point in the thread that I had been lazy when translating the ALF code from EasyLanguage to MQL4 and did not provide the correct calculation when the Median parameter is an even number. This update corrects that lapse.
Update 3/29/10 - and yet another mistake. ALF is now (I hope) mathematically sound.
Update 4/4/10 - After several weeks of live forward testing (the best kind) I have determined the following:
1. The slope of ALF is not as important as I originally thought - the relationship between ALF and PA is critical.
2. I have changed the settings for TVI for my own trading. Rather than the default (12, 12, 5) I now use 8, 8, 5. Check this out and see if it appears right for you.
Attached Image

Attached File(s)
Old Benjamin was right

