G/U out + 20 at 38.2% ret.#337, G/J out +15 at 38.2% ret #339, E/U still holding from 3505 #340.
Even though it is coming my way it did not performed as expected at the expected time. So I am out and waiting for a new signal. I held those terribles trades because they couldn't close lower that any other previous day at range #357.
Looks good, you went in when I get out, that's something isn't it. I'm flat with bullish bias......(building charts)
Ignored
long might be good due to overcrowded bear side, but I still prefer to respect the pivot and other stuffs,
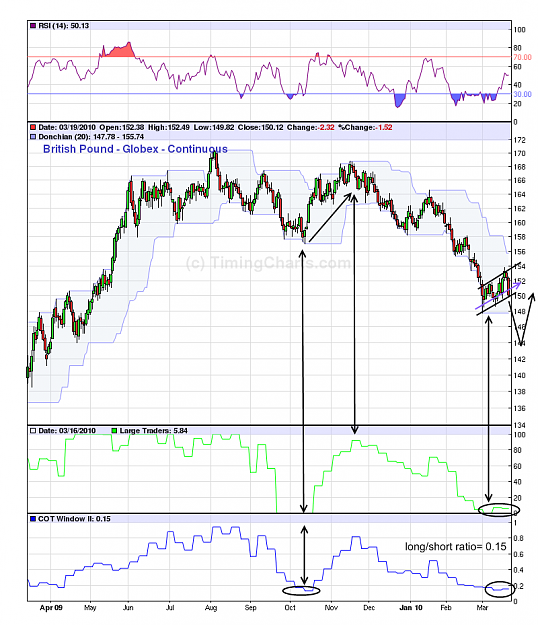
I posted this COT analysis in my thread "weekly COT analysis" and DT thread but I post it again here if you didnt look at it before.
Looks good, you went in when I got out, that's something isn't it. I'm flat with bullish bias. Notice daily TL as support + in my EW count wave 4th is not finish yet.
Hi TLC,
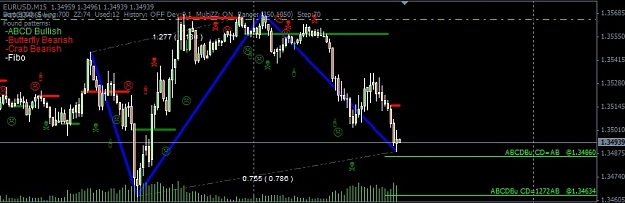
I spotted this AB=CD pattern on GBPJPY 4hr chart last week. I took a short from point D but the challenge is where to place my TP(s). Can you kindly help me out with this as I am yet new to this harmonic trading method.
Thanks.
Hi TLC,
I spotted this AB=CD pattern on GBPJPY 4hr chart last week. I took a short from point D but the challenge is where to place my TP(s). Can you kindly help me out with this as I am yet new to this harmonic trading method.
Thanks.
Ignored
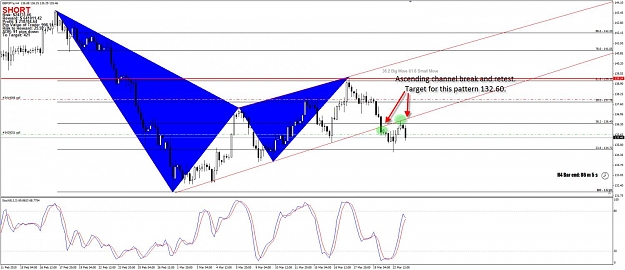
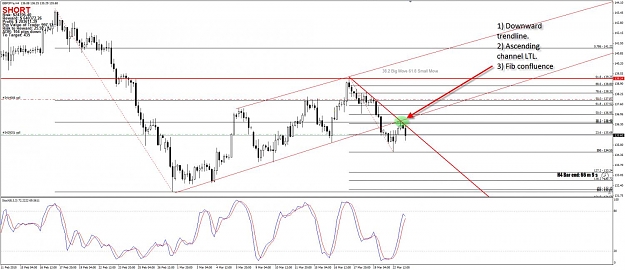
We have a very similar trade on. It has also shown additional bearish properties with the ascending channel breakout and retest / rejection. 135.20 will tell us a lot on this attempt down.
Attached Image (click to enlarge)
Every time you use 'hopium' in a post, God kills a kitten.
We have a very similar trade on. It has also shown additional bearish properties with the ascending channel breakout and retest / rejection. 135.20 will tell us a lot on this attempt down.
Ignored
Looks like it may be saying something already.
Every time you use 'hopium' in a post, God kills a kitten.
Hi TLC,
I spotted this AB=CD pattern on GBPJPY 4hr chart last week. I took a short from point D but the challenge is where to place my TP(s). Can you kindly help me out with this as I am yet new to this harmonic trading method.
Thanks.
Ignored
Drag the fibo from C to D, your T1 could be 38.2% and T2 at 61.8%.
G, it is no news that Hedge Funds are still targeting the Euro and building big short positions. the EU attacked the 1.3450 area again and got rejected though it is looking like a break is coming because of the Greek issue and German and French politicians continuing to bicker. And in typical fashion the market is reacting to their comments. It is obvious Germany does not want the EU to help greece instead they want to difer that responsiblity to the IMF and the non european countries that contribute to the IMF, the biggest being the USA.
But seeing your style of trading you are prudent to wait for a retracement back up to the Resistance line area at 1.3700 so that you can SELL into this downtrend again. It may take a few sessions to get there but it should pay off for you. And remember to keep your risk ration 1:1 so if you are profit target is 50 pips then keep your stop loss 50 as well. Or if you are looking to make a 100 pips then your stop should be 100 away from your entry...
If we continue in this range a diamond formation is imminent. Among this diamond pattern I have some other reasons to be bullish: 1. This descending broadening wedge broke to the upside #361 2. Diamond formation at bottom (reversal pattern) 3. Last but not least we are at the bottom of this consolidation period. Target is the length of the diamond axis or 61.8% from recent drop, both confluence at .3680.
Well, I'm short from yesterday's touch of the red line, but am a bit disappointed by the reaction so far. Let's hope we get some distance tonight/tomorrow.
And as I'm optimistic, I added a blue pitchfork to follow price should we manage to break below the green & yellow fork.
Ignored
Good job Hell, from my part I'm still flat and evaluating my possible entries. Won't be holding any positions until my charts speak to me clearly. My last set up didn't come to a conclusion #377