• Home
  • Forums
  • Trades
  • News
  • Calendar
  • Market
  • Brokers
  • Login
  • Join
  • User/Email: Password:
  • 4:06am
Menu
  • Forums
  • Trades
  • News
  • Calendar
  • Market
  • Brokers
  • Login
  • Join
  • 4:06am
Sister Sites
  • Metals Mine
  • Energy EXCH
  • Crypto Craft

Options

Bookmark Thread

First Page First Unread Last Page Last Post

Print Thread

Similar Threads

One hour tunnel method 2 replies

Tunnel Vision. Independent Signals & Positioning Recommendations. 189 replies

4 hour tunnel confusion 8 replies

I am confused about all the different Tunnel methods out there...Clarificatio n please 3 replies

Questions re: MT4 and VWB 1 Hr Tunnel 0 replies

  • Trading Systems
  • /
  • Reply to Thread
  • Subscribe
  • 95
Attachments: Lost in the Tunnel...
Exit Attachments

Lost in the Tunnel...

  • Last Post
  •  
  • 1 1213Page 141516 30
  • 1 13Page 1415 30
  •  
  • Post #261
  • Quote
  • Dec 28, 2005 5:55pm Dec 28, 2005 5:55pm
  •  xspowerx
  • | Joined Nov 2005 | Status: Member | 174 Posts
Acually Im short GBPJPY at 202.41
 
 
  • Post #262
  • Quote
  • Dec 28, 2005 11:41pm Dec 28, 2005 11:41pm
  •  firehorse
  • | Joined Mar 2005 | Status: Member | 207 Posts
Hi,
Quoting diallist
Disliked
I've done a partial backtest for the second period. I got 2469 pips just through March 9th. Just eyeballing the charts I can see I would get more through the end of the sell cycle at 5/21/04. I would have done the whole period but I've got inlaws wanting feeding so I've got to go. I did this kind of quickly so be wary of any errors I might have made.

Are you taking both primary and secondary signals? If you take just the primaries, you'll miss out on a lot of pips.

FYI, I entered my "trades" 20 pips beyond the neutral line, and exited either when a fib level was hit or price moved 20 pips beyond the neutral line in the opposite direction.

Dial
Ignored
Thanks for your reply.

I was taking both primary and secondary trades. Entry at close of 4hr bar at the close price. I was hoping to duplicate the original results without any tweaks.

I'll have a look and put the tweak of +/-20 from the neutral line and report back.

Thanks again for doing the backtest.

Best regards
Alan
 
 
  • Post #263
  • Quote
  • Dec 29, 2005 12:02am Dec 29, 2005 12:02am
  •  diallist
  • Joined Sep 2004 | Status: Member | 1,464 Posts
Quoting firehorse
Disliked
Hi,Thanks for your reply.

I was taking both primary and secondary trades. Entry at close of 4hr bar at the close price. I was hoping to duplicate the original results without any tweaks.

I'll have a look and put the tweak of +/-20 from the neutral line and report back.

Thanks again for doing the backtest.

Best regards
Alan
Ignored
Good deal Alan. One other thing. I took profit when the price hit the CURRENT fib level, and NOT what the fib level was at the time the trade was entered. I'm sure you're aware of this, but for those who aren't, the fib levels are dynamic and change from bar to bar. Since price is attracted to the fib levels I adjust the two limits in my order every four hours. If the fib levels are moving in the direction of my trade, this allows me to capture a few more pips.

Dial

P.S. The date of the second trade in the spreadsheet is wrong. It should be 1-28 instead of 1-27.
sxaxlxvxaxtxixoxnxbxyxgxrxaxcxexdxoxtxoxrxgx
 
 
  • Post #264
  • Quote
  • Dec 29, 2005 12:48am Dec 29, 2005 12:48am
  •  xspowerx
  • | Joined Nov 2005 | Status: Member | 174 Posts
I can't seem to get it one good trade on this in the last week.

Gotta keep trying!
 
 
  • Post #265
  • Quote
  • Dec 29, 2005 1:03am Dec 29, 2005 1:03am
  •  diallist
  • Joined Sep 2004 | Status: Member | 1,464 Posts
Quoting xspowerx
Disliked
I can't seem to get it one good trade on this in the last week.

Gotta keep trying!
Ignored
It's been a choppy week. Usually is around Christmas. I suspect volume has been low as well. Things should pick back up after New Years. Just remember to wait for the signals before entering rather than anticipating them. Remember to think of your trading as a sniper's rifle rather than a machine gun. Don't shoot at everything that moves. Pick your target carefully, then squeeze off that one shot.

Dial
sxaxlxvxaxtxixoxnxbxyxgxrxaxcxexdxoxtxoxrxgx
 
 
  • Post #266
  • Quote
  • Dec 29, 2005 3:05am Dec 29, 2005 3:05am
  •  firehorse
  • | Joined Mar 2005 | Status: Member | 207 Posts
Hi,

Move over HeavyJ, I'm about to take over your title for being a boneheaded trader :

Thanks again Diallist for your backtested results, it gives me something to compare against.

Boneheaded point No.1
As I understand it, the value of the weekly momentum only 'finalises' at the end of the week and until the market closes on Fri, I would not know the value of the momentum for that week, so I could not trade mon-fri based on the close of the momentum of that week.

On my chart (datafeed based on NY time, 4hr bars aligned to 0:00),
Momentum for week ending 16/1/04 is 542.20
Momentum for week ending 23/1/04 is 559.33
Momentum for week ending 30/1/04 is 554.20
Momentum for week ending 06/2/04 is 526.63

In 'theory' I would not 'short' until after 30/1/04 as until the close of the week it is not certain that the momentum has turned south.

Diallist had a short on 23/1/04 at 1.2693 for +300 which I will put to one side for the moment until I can determine what the program should mechanically do with going short on a higher weekly momentum.

Boneheaded point No.2
The original vegas document had a weekly filter "If the difference between the 21 EMA and the 5 EMA is > 500 pips, then the pip difference from the prior week must change by more than 10 pips, or just go lower over 2 consecutive weeks, to signal a trend change."
From the numbers in point no.1, weekly momentum is over 500 pips and the change from 23/1/04 to 30/1/04 is less than 10 pips, so once again in my boneheaded 'theory', the momentum could still be up and only 'longs' should be taken until after 06/2/04 where it has definitely dropped for 2 consecutive weeks.

Boneheaded point No.3
Quoting diallist
Disliked
P.S. The date of the second trade in the spreadsheet is wrong. It should be 1-28 instead of 1-27.
Ignored
Thanks, saved me pulling my hair out

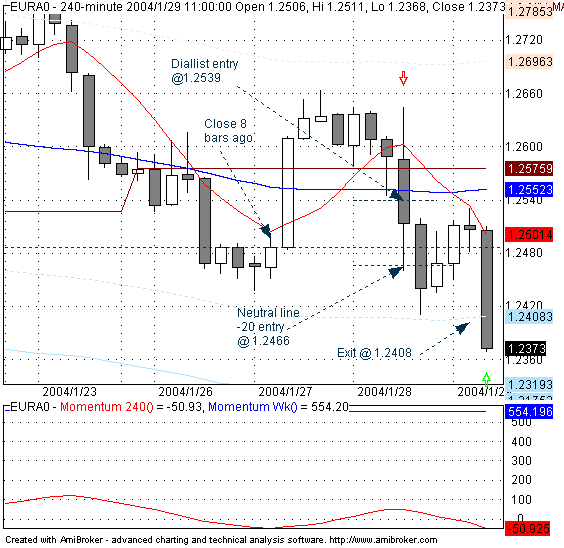
Diallist has a short (lot 1) on 28/1/04 at 1.2539 to hit fib144 at 1.2412 for 127pips
Exit I have no problem with as mine comes out at 1.2408, close enough

This could all be to do with datafeed or 4hr bar alignment and I'd like to find out which.

On my chart, the bar ending at 16:00 closes at 1.2514 with 8 MA rising from previous bar to 1.2603
The close 8 bars ago is 27/1/04 1.2486
Thus the neutral price is 1.2486
My boneheaded understanding (20pip rule) is if the price now goes below 1.2466 (low is 1.2459) then you would short at 1.2466 which is the price I get, short at 1.2466, exit 1.2408 for 58pips

How did you get an entry at 1.2539?

I've attached a chart.
Short on the hollow red arrow
Cover on the hollow green arrow
The middle dotted line is the price 1.2486 from 8 bars ago from the short.
Red line is 8 MA Close (4hr)
Blue line is 55 MA (H+L/2)(4hr)
Light Blue dotted line is fib144 from 55MA
Brown line is 5 MA (H+L/2) weekly

I would be grateful if anyone could help me out of my boneheadedness

Best regards
Alan
Attached Image
 
 
  • Post #267
  • Quote
  • Dec 29, 2005 2:25pm Dec 29, 2005 2:25pm
  •  xspowerx
  • | Joined Nov 2005 | Status: Member | 174 Posts
Hey Firehorse, I think you missed the new update.

He has a V2.0 out by email to one of our members who kindly shared it with us. It eliminated the calculation of weekly momentum. In my opinion, I think its better.
 
 
  • Post #268
  • Quote
  • Dec 29, 2005 3:12pm Dec 29, 2005 3:12pm
  •  xspowerx
  • | Joined Nov 2005 | Status: Member | 174 Posts
Quoting diallist
Disliked
It's been a choppy week. Usually is around Christmas. I suspect volume has been low as well. Things should pick back up after New Years. Just remember to wait for the signals before entering rather than anticipating them. Remember to think of your trading as a sniper's rifle rather than a machine gun. Don't shoot at everything that moves. Pick your target carefully, then squeeze off that one shot.

Dial
Ignored
Thanks for the relief. Its good to know that.

I do enter right when I get the signal and it seems like I've been stopped out on most before. However, when I look back in history it seems to trend perfectly fine. Makes me think its only my luck haha
 
 
  • Post #269
  • Quote
  • Dec 29, 2005 4:41pm Dec 29, 2005 4:41pm
  •  HeavyJ
  • | Joined Oct 2005 | Status: Member | 254 Posts
Greetings xspowersX

just Curious how tight your playing your stops on this? I think Mine were way to tight.

I have re-evaluated this after PURCHASING and reading BWILC

Lets get 'em next year
HJ

Quoting xspowerx
Disliked
Thanks for the relief. Its good to know that.

I do enter right when I get the signal and it seems like I've been stopped out on most before. However, when I look back in history it seems to trend perfectly fine. Makes me think its only my luck haha
Ignored
HeavyJ -"Posterboy for Spellchecker!" "Will work for pips!"
 
 
  • Post #270
  • Quote
  • Dec 29, 2005 4:55pm Dec 29, 2005 4:55pm
  •  diallist
  • Joined Sep 2004 | Status: Member | 1,464 Posts
Quoting xspowerx
Disliked
Thanks for the relief. Its good to know that.

I do enter right when I get the signal and it seems like I've been stopped out on most before. However, when I look back in history it seems to trend perfectly fine. Makes me think its only my luck haha
Ignored
Unfortunately, history only shows the last thing that happened. For example, if history shows a slope change that began a long trend, that is not the whole story. Sure, that 4 hour bar ended up on a permanent slope change, but it may have switched slope a couple of times before settling down. I don't know what you are using for an entry signal, so I'll assume you're inputting trailing entries at the beginning of a 4 hour bar to trigger when the price moves 20 pips beyond the neutral line and you're setting your stop to close the trade if the price moves back to 20 pips on the opposite side of the neutral line (effectively, a 40 pip stop). Here's what can happen:

You've set your entry stop order and stop loss as just described at the beginning of the 4 hour bar and you walk away from your computer. While you're away the entry stop order triggers and you are now short. An hour later, the price reverses, crosses the neutral line and hits your stop. Yet a little later, the price moves across the neutral line again and begins a long move down. Unfortunately, you are not in. So the historical record shows a signal that resulted in a long winning trade. But, the historical record does not show that the slope dithered a couple of times before settling down, taking out your trade in the process.

You can decrease the likelyhood of this scenario by increasing the size of your stop by setting the stop more than 20 pips beyond the neutral line, to give the trade more breathing room. The cost of course will be an increase in the size of your loss per trade, but if it results in fewer stop outs, your overall losses will actually decrease. It is a balancing act.

Another option would be to keep the 40 pip stop, and simply monitor your charts so that if your trailing entry does get triggered and then stopped out, you can re-enter the trailing entry to catch the final slope change that becomes part of the historical record.

As you can see, there is no easy solution since most of us can't be glued to our monitors all day.

As a general recommendation, if you are getting stopped out a lot, especially from what ends up being a good trade, then you need to increase the size of your stop.

Two questions for you: What are you using for your entry signal? The close of the bar across the neutral line, or a fixed number of pips or just visually seeing the slope change? Second, how are you setting your stops? A fixed pip amount; a certain number of pips beyond the neutral line, or perhaps just beyond the last swing high or low?

Dial
sxaxlxvxaxtxixoxnxbxyxgxrxaxcxexdxoxtxoxrxgx
 
 
  • Post #271
  • Quote
  • Dec 29, 2005 5:05pm Dec 29, 2005 5:05pm
  •  diallist
  • Joined Sep 2004 | Status: Member | 1,464 Posts
Quoting xspowerx
Disliked
Hey Firehorse, I think you missed the new update.

He has a V2.0 out by email to one of our members who kindly shared it with us. It eliminated the calculation of weekly momentum. In my opinion, I think its better.
Ignored
You may be right, but I'm not yet convinced the addition of the daily chart and the 24 & 28 ma's is a replacement for the weekly trend indication. Perhaps more a supplement to it. We'll have to wait for Vegas to reply to this thread to know for sure (hope he hasn't forgotten us )

For my part, since I've already got lots of screenshots in the PF detailing the use of the weekly trend chart, I'm going to leave it in place. Any updates I get from Vegas will be included as appendices to the main system description.

Dial
sxaxlxvxaxtxixoxnxbxyxgxrxaxcxexdxoxtxoxrxgx
 
 
  • Post #272
  • Quote
  • Dec 29, 2005 10:09pm Dec 29, 2005 10:09pm
  •  firehorse
  • | Joined Mar 2005 | Status: Member | 207 Posts
Hi,
Quoting xspowerx
Disliked
Hey Firehorse, I think you missed the new update.

He has a V2.0 out by email to one of our members who kindly shared it with us. It eliminated the calculation of weekly momentum. In my opinion, I think its better.
Ignored
I'm floundering a bit here.

The original 4 hr tunnel should be profitable but I think I don't understand the rules properly because I cannot as yet duplicate the original results.

The new 20pip rule by Diallist seems even better but I can't seem to duplicate his results from the above post as yet. There's a misunderstanding somewhere.

The updated rules by vegas seems to be in development and there is nothing to compare against at the moment. I would prefer if I could understand the discrepancies above before moving onto another system along this theme.

Best regards
Alan
 
 
  • Post #273
  • Quote
  • Edited Dec 31, 2005 3:33am Dec 30, 2005 8:37pm | Edited Dec 31, 2005 3:33am
  •  keris2112
  • | Joined Oct 2005 | Status: Member | 13 Posts
Hi all,

I've been a member here for a while, but I don't think I've ever posted. I post a lot at other forums and just never quite got around to FF very often. Wow, was that a mistake. You guys are great.

I've been interested in the Vegas method for a few months and I've played around with the indicators by Spiggy and tried making my own adjustments. I'm still in that demo/learning stage of my trading career so this thread has been really enjoyable to read.

I think the thing I like most about the 4 Hour Tunnel is that it is not "gimmicky" to me. Maybe that sounds dumb, but there are so many new "super-duper make-you-rich-in-a-month" strategies out there that it makes it difficult for a new trader to focus on making something work. The 4hr Tunnel seems to just be based on a solid foundation and if it is traded with some discretion, it should be profitable.

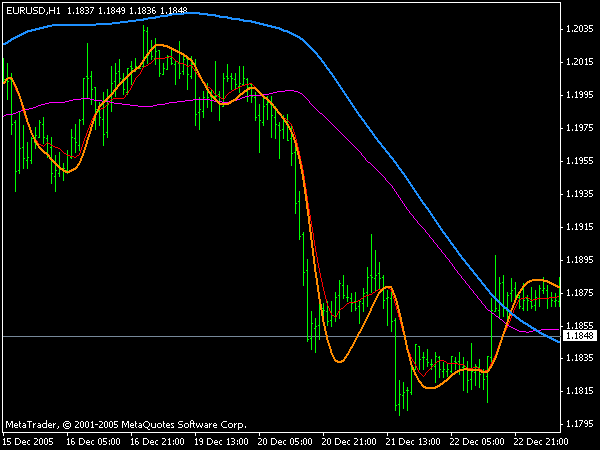
Anyway, back to my reason for posting. I've found that if you use a 25 HMA (Hull Moving Average) on the 4hr chart instead of the 8 SMA it gives cleaner signals. The REAL turns happen at pretty much the same time, but because it is so much smoother, it filters out a lot of the "head fakes" that the 8 SMA gives. The 8 SMA tends to make a lot of small "bounces" when there is a small retrace in price causing it to officially change direction (even if by only a few pips and for only 1 bar), which according to the system takes you out of the trade. The 25 HMA smoothes right through those small retraces.

I also found that replacing the 55 SMA on the 4hr with a 233 HMA gives interesting results. It follows the twists and turns of the 55 SMA pretty evenly, but during ranging markets it tends to stay a little further away from price, thus, when you get bounced in and out of the market due to turns on the Short MA, you are only entering with 1/2 positions.

I'm attaching a picture to show you what I mean. The SMAs are the thin lines and the HMA are the thicker lines.

Also, I'm attaching the HMA.mq4 file for Metatrader. You can find more info about the Hull Moving Average at Alan Hull's website under the Articles section (or just Google it). I don't think I'm allowed to post an actual link to a website yet. If you click on the Articles section it takes you to a site where he sells a newsletter. (Lots of good free articles too) I'm not affiliated with that in any way. I just want you to know where to go to find info on the HMA and he gives a full description of it there and shows you the formula.

Well, I guess this is long enough for a first post. Thanks again for a great thread. I look forward to contributing here.

Keris
Attached Images
Attached File
File Type: mq4 HMA.mq4   3 KB | 454 downloads
 
 
  • Post #274
  • Quote
  • Dec 30, 2005 9:04pm Dec 30, 2005 9:04pm
  •  james16
  • | Commercial Member | Joined Feb 2005 | 2,875 Posts
Quoting keris2112
Disliked
Hi all,

I've been a member here for a while, but I don't think I've ever posted. I post a lot at other forums and just never quite got around to FF very often. Wow, was that a mistake. You guys are great.

I've been interested in the Vegas method for a few months and I've played around with the indicators by Spiggy and tried making my own adjustments. I'm still in that demo/learning stage of my trading career so this thread has been really enjoyable to read.

I think the thing I like most about the 4 Hour Tunnel is that it is not "gimmicky" to me. Maybe that sounds dumb, but there are so many new "super-duper make-you-rich-in-a-month" strategies out there that it makes it difficult for a new trader to focus on making something work. The 4hr Tunnel seems to just be based on a solid foundation and if it is traded with some discretion, it should be profitable.

Anyway, back to my reason for posting. I've found that if you use a 25 HMA (Hull Moving Average) on the 4hr chart instead of the 8 SMA it gives cleaner signals. The REAL turns happen at pretty much the same time, but because it is so much smoother, it filters out a lot of the "head fakes" that the 8 SMA gives. The 8 SMA tends to make a lot of small "bounces" when there is a small retrace in price causing it to officially change direction (even if by only a few pips and for only 1 bar), which according to the system takes you out of the trade. The 25 HMA smoothes right through those small retraces.

I also found that replacing the 55 SMA on the 4hr with a 233 HMA gives interesting results. It follows the twists and turns of the 55 SMA pretty evenly, but during ranging markets it tends to stay a little further away from price, thus, when you get bounced in and out of the market due to turns on the Short MA, you are only entering with 1/2 positions.

I'm attaching a picture to show you what I mean. The SMAs are the thin lines and the HMA are the thicker lines.

Also, I'm attaching the HMA.mq4 file for Metatrader. You can find more info about the Hull Moving Average at Alan Hull's website under the Articles section (or just Google it). I don't think I'm allowed to post an actual link to a website yet. If you click on the Articles section it takes you to a site where he sells a newsletter. (Lots of good free articles too) I'm not affiliated with that in any way. I just want you to know where to go to find info on the HMA and he gives a full description of it there and shows you the formula.

Well, I guess this is long enough for a first post. Thanks again for a great thread. I look forward to contributing here.

Keris
Ignored
welcome aboard friend to the best forex forum on the web. you will find kind and caring people here. when a bad guy shows up occasionally our resident wizard waves his wand and poof thier gone. it makes for a really cool place to learn and ask questions. jim
 
 
  • Post #275
  • Quote
  • Dec 31, 2005 12:01am Dec 31, 2005 12:01am
  •  merlin
  • Joined Mar 2004 | Status: Magic Man | 3,220 Posts
wow, i hadnt got around to checking this thread out lately...

some good chit man, very good chit.
Relax and be happy.
 
 
  • Post #276
  • Quote
  • Dec 31, 2005 1:34am Dec 31, 2005 1:34am
  •  Antra
  • Joined Jun 2004 | Status: Member | 387 Posts
Quoting keris2112
Disliked
Hi all,

I've been a member here for a while, but I don't think I've ever posted. I post a lot at other forums and just never quite got around to FF very often. Wow, was that a mistake. You guys are great.

I've been interested in the Vegas method for a few months and I've played around with the indicators by Spiggy and tried making my own adjustments. I'm still in that demo/learning stage of my trading career so this thread has been really enjoyable to read.

I think the thing I like most about the 4 Hour Tunnel is that it is not "gimmicky" to me. Maybe that sounds dumb, but there are so many new "super-duper make-you-rich-in-a-month" strategies out there that it makes it difficult for a new trader to focus on making something work. The 4hr Tunnel seems to just be based on a solid foundation and if it is traded with some discretion, it should be profitable.

Anyway, back to my reason for posting. I've found that if you use a 25 HMA (Hull Moving Average) on the 4hr chart instead of the 8 SMA it gives cleaner signals. The REAL turns happen at pretty much the same time, but because it is so much smoother, it filters out a lot of the "head fakes" that the 8 SMA gives. The 8 SMA tends to make a lot of small "bounces" when there is a small retrace in price causing it to officially change direction (even if by only a few pips and for only 1 bar), which according to the system takes you out of the trade. The 25 HMA smoothes right through those small retraces.

I also found that replacing the 55 SMA on the 4hr with a 233 HMA gives interesting results. It follows the twists and turns of the 55 SMA pretty evenly, but during ranging markets it tends to stay a little further away from price, thus, when you get bounced in and out of the market due to turns on the Short MA, you are only entering with 1/2 positions.

I'm attaching a picture to show you what I mean. The SMAs are the thin lines and the HMA are the thicker lines.

Also, I'm attaching the HMA.mq4 file for Metatrader. You can find more info about the Hull Moving Average at Alan Hull's website under the Articles section (or just Google it). I don't think I'm allowed to post an actual link to a website yet. If you click on the Articles section it takes you to a site where he sells a newsletter. (Lots of good free articles too) I'm not affiliated with that in any way. I just want you to know where to go to find info on the HMA and he gives a full description of it there and shows you the formula.

Well, I guess this is long enough for a first post. Thanks again for a great thread. I look forward to contributing here.

Keris
Ignored
Hi Keris,

I too have been playing around with the vegas tunnel and trying to work out how to trade it in a more mechanical fashion.

I came across the HMA a few weeks ago and found it to be a pretty good little indicator. Seems to have very little lag.

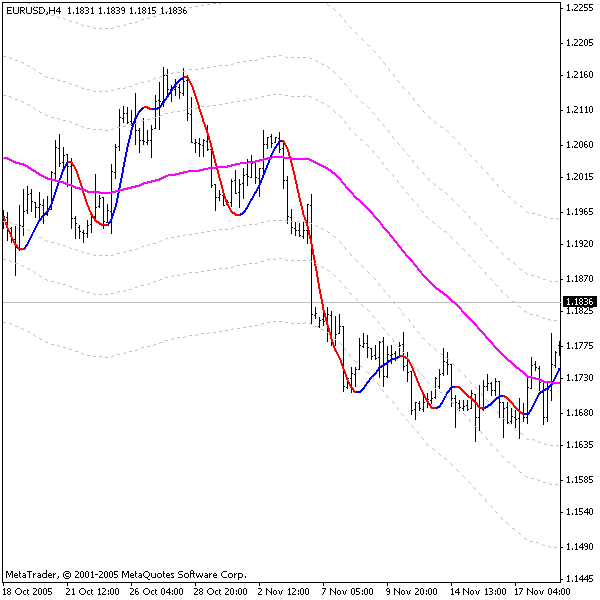
The one I have been using is 'HMA in colour'.
It changes colour as the trend turns...but here is the problem.
I am not 100% sure that once the bar has finished that the colour will remain changed.

Anyone willing to test it?

I first thought of putting this indicator on the weekly chart in place of the 28ema that Vegas mentioned as it seemed ( to me) to be giving more direction.

Anyway this is the HMA in colour on a setting of 21
Attached Image
 
 
  • Post #277
  • Quote
  • Dec 31, 2005 1:37am Dec 31, 2005 1:37am
  •  Antra
  • Joined Jun 2004 | Status: Member | 387 Posts
What do you think?
Attached Image
 
 
  • Post #278
  • Quote
  • Dec 31, 2005 1:39am Dec 31, 2005 1:39am
  •  james16
  • | Commercial Member | Joined Feb 2005 | 2,875 Posts
Quoting Antra
Disliked
Hi Keris,

I too have been playing around with the vegas tunnel and trying to work out how to trade it in a more mechanical fashion.

I came across the HMA a few weeks ago and found it to be a pretty good little indicator. Seems to have very little lag.

The one I have been using is 'HMA in colour'.
It changes colour as the trend turns...but here is the problem.
I am not 100% sure that once the bar has finished that the colour will remain changed.

Anyone willing to test it?

I first thought of putting this indicator on the weekly chart in place of the 28ema that Vegas mentioned as it seemed ( to me) to be giving more direction.

Anyway this is the HMA in colour on a setting of 21
Ignored
hello antra, did you get my email? antra is a tunnel pro.
 
 
  • Post #279
  • Quote
  • Dec 31, 2005 1:41am Dec 31, 2005 1:41am
  •  Antra
  • Joined Jun 2004 | Status: Member | 387 Posts
Here is the indicator.

btw Alan Hull = Aussie...oi oi oi
Attached File
File Type: mq4 HMA_Color.mq4   3 KB | 528 downloads
 
 
  • Post #280
  • Quote
  • Dec 31, 2005 1:43am Dec 31, 2005 1:43am
  •  Antra
  • Joined Jun 2004 | Status: Member | 387 Posts
Quoting james16
Disliked
hello antra, did you get my email? antra is a tunnel pro.
Ignored
Yes James......have you checked your email?????
And Trey's thread????
 
 
  • Trading Systems
  • /
  • Lost in the Tunnel...
  • Reply to Thread
    • 1 1213Page 141516 30
    • 1 13Page 1415 30
0 traders viewing now
  • More
Top of Page
  • Facebook
  • Twitter
About FF
  • Mission
  • Products
  • User Guide
  • Media Kit
  • Blog
  • Contact
FF Products
  • Forums
  • Trades
  • Calendar
  • News
  • Market
  • Brokers
  • Trade Explorer
FF Website
  • Homepage
  • Search
  • Members
  • Report a Bug
Follow FF
  • Facebook
  • Twitter

FF Sister Sites:

  • Metals Mine
  • Energy EXCH
  • Crypto Craft

Forex Factory® is a brand of Fair Economy, Inc.

Terms of Service / ©2022