• Home
  • Forums
  • Trades
  • News
  • Calendar
  • Market
  • Brokers
  • Login
  • Join
  • User/Email: Password:
  • 10:59pm
Menu
  • Forums
  • Trades
  • News
  • Calendar
  • Market
  • Brokers
  • Login
  • Join
  • 10:59pm
Sister Sites
  • Metals Mine
  • Energy EXCH
  • Crypto Craft

Options

Bookmark Thread

First Page First Unread Last Page Last Post

Print Thread

Similar Threads

Twitch Journal - Live Journal 4 replies

Creating my Trading Plan + My Trading Journal 27 replies

Another Trading Journal - Yuhu's Journal 16 replies

My Personal journal up 18% in 2 months going to start a journal 8 replies

Azzity's Trading Journal III (Azzity's 3/30 Trading Method) 9 replies

  • Trading Journals
  • /
  • Reply to Thread
  • Subscribe
  • 808
Attachments: KissFan's Trading Journal
Exit Attachments

KissFan's Trading Journal

  • Last Post
  •  
  • 1 3233Page 343536 66
  • 1 33Page 3435 66
  •  
  • Post #661
  • Quote
  • Mar 11, 2010 8:46am Mar 11, 2010 8:46am
  •  KissFan
  • Joined Jan 2008 | Status: In Fibonacci We Trust | 2,334 Posts
Quoting Bleek
Disliked
Mr Kiss I never did ask, or read in your thread, why you changed from candles to bars?

I myself made the change at the start of this year because I find they give me an objective picture, candle shapes seem to sway me too much.
Ignored

Very simply, I wanted to trade using the same tools as the successsful traders do on J16.

K.I.S.S.
  • Post #662
  • Quote
  • Mar 12, 2010 10:14am Mar 12, 2010 10:14am
  •  KissFan
  • Joined Jan 2008 | Status: In Fibonacci We Trust | 2,334 Posts
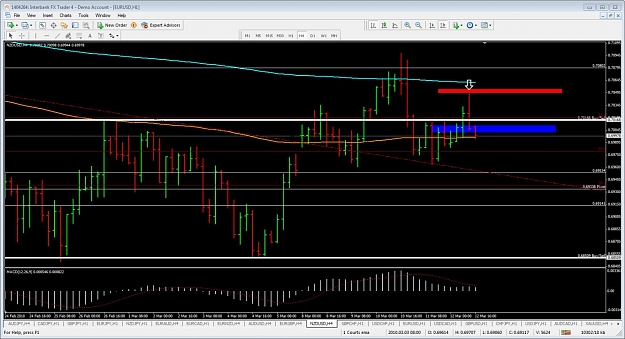
Short at .7002 First target 6980.

K.I.S.S.
Attached Image (click to enlarge)
Click to Enlarge

Name: nzdusdfibstrike.jpg
Size: 148 KB
  • Post #663
  • Quote
  • Mar 12, 2010 10:20am Mar 12, 2010 10:20am
  •  KissFan
  • Joined Jan 2008 | Status: In Fibonacci We Trust | 2,334 Posts
Quoting KissFan
Disliked
Long at the break of the 4hr pin. Great location.

K.I.S.S.
Ignored
Entry Long 1.3582 Closed 03.12.2010 1.3760


K.I.S.S.
Attached Image (click to enlarge)
Click to Enlarge

Name: eurusd03122010fibstrikeclosed.jpg
Size: 149 KB
  • Post #664
  • Quote
  • Mar 12, 2010 10:27am Mar 12, 2010 10:27am
  •  KissFan
  • Joined Jan 2008 | Status: In Fibonacci We Trust | 2,334 Posts
Quoting KissFan
Disliked
Short at the break of the 4hr pin. Great location.

K.I.S.S.
Ignored
Short 1.0761 Take Profit 1.0616

K.I.S.S.
Attached Image (click to enlarge)
Click to Enlarge

Name: usdchf03122010fibstrikeclosed.jpg
Size: 146 KB
  • Post #665
  • Quote
  • Mar 12, 2010 4:57pm Mar 12, 2010 4:57pm
  •  unlv_tj
  • Joined Oct 2007 | Status: Member | 1,288 Posts
Quoting KissFan
Disliked
Short at .7002 First target 6980.

K.I.S.S.
Ignored
KISS FAN, love reading your posts on J16 and your trading journal here.

I took a loss on the NZDUSD daily pin, made some mistakes, still learning.

You went short at .7002. Did you believe that the pin was strong enough to break though .7000 with ease, and that .6980 was an easy first place to move to BE/take profit?

The BRN of .7000 scared me to not short until .6975, so I was just getting in, when you were already going to break even.

Just curious, and thank you.

T.J.
  • Post #666
  • Quote
  • Mar 12, 2010 7:10pm Mar 12, 2010 7:10pm
  •  KissFan
  • Joined Jan 2008 | Status: In Fibonacci We Trust | 2,334 Posts
Quoting unlv_tj
Disliked
KISS FAN, love reading your posts on J16 and your trading journal here.

I took a loss on the NZDUSD daily pin, made some mistakes, still learning.

You went short at .7002. Did you believe that the pin was strong enough to break though .7000 with ease, and that .6980 was an easy first place to move to BE/take profit?

The BRN of .7000 scared me to not short until .6975, so I was just getting in, when you were already going to break even.

Just curious, and thank you.

T.J.
Ignored
Hey TJ,

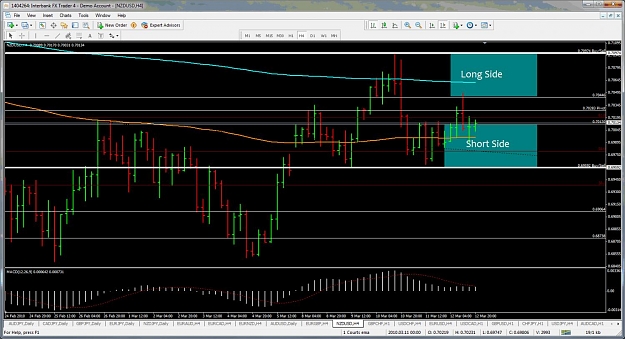
I was just updating my charts for next weeks trading when I saw your post. Here is how I se NZDUSD for next week and why I took this trade. I too see the .7000 level and believe that the probability is high that we will move down from 7000. The .6959 area is where most of my money will come off the trade. I believe that we will retest that area before moving back up IF the price does in fact go up from here. When I see a decent rejection of price from the pivot area as the bar I trades off of illustrated, I will take the trade. That is the primary reason for taking this trade. I also see a classic pattern emerging (head adshoulders) and believe that it will complete itself before stopping me out. Some can argue that I am taking a counter trend trade and that is true but more times than not, when the PA forms in the middle of the weekly range and breaks through the 38.2 or the 61.8 it will head back up/down to the 0/100.

K.I.S.S.
Attached Image (click to enlarge)
Click to Enlarge

Name: nzdusdfibstrike03122010.jpg
Size: 155 KB
  • Post #667
  • Quote
  • Mar 15, 2010 7:10am Mar 15, 2010 7:10am
  •  KissFan
  • Joined Jan 2008 | Status: In Fibonacci We Trust | 2,334 Posts
Quoting KissFan
Disliked
Hey TJ,

I was just updating my charts for next weeks trading when I saw your post. Here is how I se NZDUSD for next week and why I took this trade. I too see the .7000 level and believe that the probability is high that we will move down from 7000. The .6959 area is where most of my money will come off the trade. I believe that we will retest that area before moving back up IF the price does in fact go up from here. When I see a decent rejection of price from the pivot area as the bar I trades off of illustrated, I will take the trade. That is...
Ignored
I ended up taking a 25 pip loss on this one. I will no longer take trades late session on friday.

K.I.S.S.
  • Post #668
  • Quote
  • Mar 15, 2010 7:12am Mar 15, 2010 7:12am
  •  KissFan
  • Joined Jan 2008 | Status: In Fibonacci We Trust | 2,334 Posts
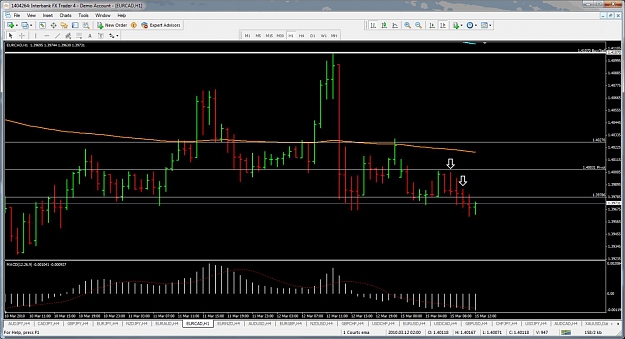
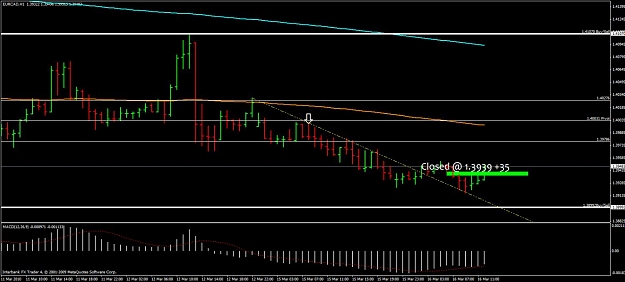
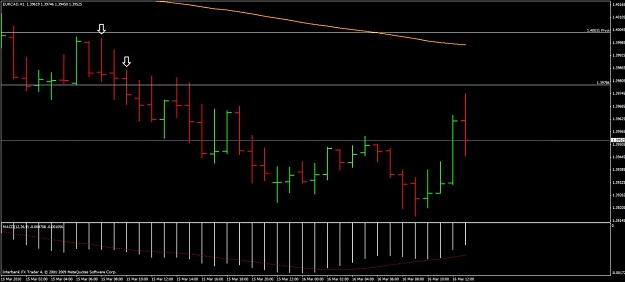
Short 1.3973 TP AT 1.3910. SL 1.4010.

K.I.S.S.
Attached Image (click to enlarge)
Click to Enlarge

Name: eurocadfibstrike03152010.jpg
Size: 133 KB
  • Post #669
  • Quote
  • Edited at 2:13pm Mar 15, 2010 2:02pm | Edited at 2:13pm
  •  KissFan
  • Joined Jan 2008 | Status: In Fibonacci We Trust | 2,334 Posts
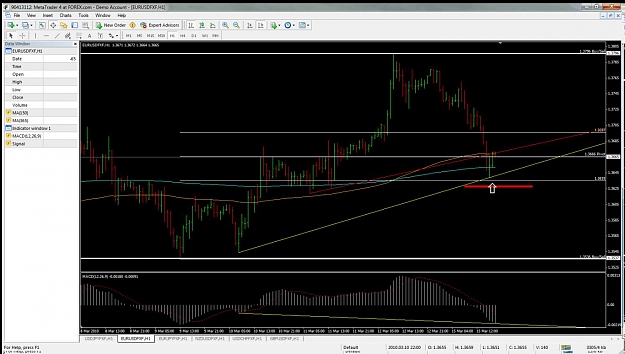
Long at theweekly 50% retrace. SL 1.3615.

K.I.S.S.
Attached Image (click to enlarge)
Click to Enlarge

Name: eurusd03152010fibstriketrade2.jpg
Size: 136 KB
  • Post #670
  • Quote
  • Mar 15, 2010 7:47pm Mar 15, 2010 7:47pm
  •  KissFan
  • Joined Jan 2008 | Status: In Fibonacci We Trust | 2,334 Posts
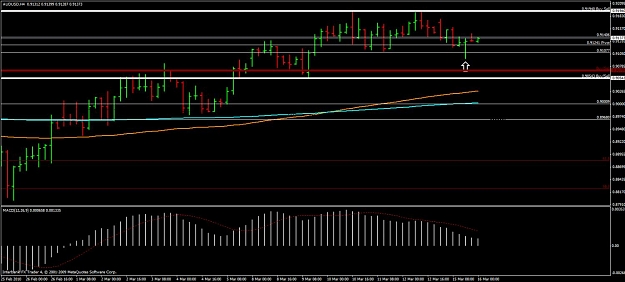
Long @ .9137.

K.I.S.S.
Attached Image (click to enlarge)
Click to Enlarge

Name: audusdfibstrike03152010.jpg
Size: 103 KB
  • Post #671
  • Quote
  • Mar 16, 2010 7:08am Mar 16, 2010 7:08am
  •  KissFan
  • Joined Jan 2008 | Status: In Fibonacci We Trust | 2,334 Posts
Quoting KissFan
Disliked
Short 1.3973 TP AT 1.3910. SL 1.4010.

K.I.S.S.
Ignored
+35
Attached Image (click to enlarge)
Click to Enlarge

Name: eurcadshortclosed03162010.jpg
Size: 100 KB
  • Post #672
  • Quote
  • Mar 16, 2010 7:45am Mar 16, 2010 7:45am
  •  Bleek
  • Joined Aug 2009 | Status: All your stops are belong to us | 770 Posts
Was that based purely on SR and PA or was there a Fib involved?
"I made all my money by selling too soon"
  • Post #673
  • Quote
  • Mar 16, 2010 7:48am Mar 16, 2010 7:48am
  •  KissFan
  • Joined Jan 2008 | Status: In Fibonacci We Trust | 2,334 Posts
Quoting Bleek
Disliked
Was that based purely on SR and PA or was there a Fib involved?
Ignored
EUROCAD?

K.I.S.S.
  • Post #674
  • Quote
  • Mar 16, 2010 8:05am Mar 16, 2010 8:05am
  •  KissFan
  • Joined Jan 2008 | Status: In Fibonacci We Trust | 2,334 Posts
K.I.S.S.Fan's Fibonacci Strike Trading---Updated March 16,2010


Here are some opinions/observations that I have formed after trading for some time. All of these are based on personal experience. I will be adding notes here as time moves forward in order to more clearly explain/improve the trading experience of the "Fibonacci Strike Technique". Most of my personal experience has been guided by the great posters on Forex Factory. When I say "Great" posters I mean the ones who have started threads that stand the test of time here. Many thanks to all of you.
1. Support and resistance are the best areas to look for price action.
2. Support and resistance change slightly over time as price breaches/violates/tests/penetrates these areas and causes them to become less reliable/detectable.
3. It is more advantageous to trade bar formations at swings that end at support or resistance areas.
4. It is even more advantageous to trade these at the break of said bar formations. (confirmation)
5. The 23.6 level on the Fibonacci tool has not been as useful a guide to me as the 0.0,38.2,50.0,61.8 or 100.0.
6. It seems mor advantageous to look for long trades once we have closed above the weekly pivot and shorts below the weely pivot. This means to observe price on your chosen time frame and only
trade when price gives you a signal that you ae comfortable with. Ex. Pin bar, BUOB, BEOB and so forth. Many examples will be forthcoming in the form of posted charts.
7. More to come........
THE JIST OF WHAT I AM DOING HERE-K.I.S.S.Fan's Fibonacci Srike Technique
I am a price action trader and frequent theJames16 thread. They are my "other" family. My trading is based on the principles taught in that thread and on the Private Forum. I am not sharing this information on the J16 thread out of respect for the beginners and veteran traders there. This type of discussion (if anyone cares to join in) would clutter Jim's thread and possibly make it confusing to beginners. I owe that man so much that I'd never want to be responsible for taking any value from his work. I trade the hourly, 4hr and daily charts. I have evidence that support and
resistance is best plotted by using the fib levels I will mention below. Fibonacci Strike is a slightly different way of looking at plotting support and resistance than I used to do. All of the "major" levels of support and resistance are updated weekly for my trading. Fibonacci Strike provides me with a refreshed lens or scope to look at the currency crosses each week. The concept of Fibonacci Strike resonates with my personality well in the sense that I am more likely to stay on the right side of the market by using the fib pivot in conjunction with good equity management and
clear price action signals. I used to open a chart and then painstakenly plot lines on S/R and PPZ areas. I am not saying that to plot S/R or PPZ's the way I was taught was wrong. I am saying that it does not seem to be necessary in the method I am discussing here. The trader can be the ultimate judge. One other thing that is important for me to convey to anyone who might happen upon this material. I am developing this for my personal trading. The material here is all borrowed. I have taken segments of material from many great traders and produced a method that works for me. There is no holy grail here. My objective is to trade consistantly profitable and pass along any helpful insight that might assist someone else in that endeavor. Again, thank you to all who have helped
me over the years. You know who you are.

I am going to get started here:
FIB TOOL- I use these settings on my fib tool. -38.2, 0.0, 38.2, 50.0, 61.8, 100.0, 138.2
CHARTS USED for plotting S/R- Monthly, weekly, daily
TIMEFRAME TRADED-Hourly, 4HR, Daily
On a monthly chart I plot my fibs with the levels mentioned above from thelow to high or high to low of the last closed candle. On a weekly chart, I plot my fibs with the levels mentioned above from the low to high or high to low of the last closed candle. On a daily chart. I plot my fibs with the levels mentioned above from the low to high or high to low of the last closed candle. I use different colors and line widths for each time frame plotted. I do not plot daily fib levels for friday or sunday. I plot only mon, tues, wed, thurs. If you are following along, go back and look at the S/R andPPZ's that you would have plotted. What do you see?
My entry methods:
Trend-I am looking for reversal set-ups . One set up that I use effectively is identified by waiting for a 6-8 hour low or high to be reached. For a buy signal, you wait for a close above the low bar and for a sell signal, you wait for a close below the high bar. These "signals" must be in conjunction with one of the fib levels plotted. Remember, I am taking the PA set-ups off of the fib levels only. I'll only enter a trade between Midnight Central time and Noon central time on Monday through Thursday for the 4HR and 1HR timeframes. I do not trade the Asain session. I trade really well formed daily TF set ups as well. The only reason why I will miss out on some good daily TF trades is that I will take more conservative entries. I take more conservative entries on daily set ups so that I can sleep peacefully at night. I will leave a trade open during the Asian session as long as it has not met my criteria to close. On any timeframe that I trade, buy signals will show themselves as price action above the weekly pivot. The best buy signals will correspond with a fib level plotted on the monthly or weekly TF. A sell signal is evident with price action below th weekly pivot. The best sell signals will correspond with a fib level plotted on the monthly or weekly TF. I am looking fo PA just like I have been taught on the J16 chart thread. The difference is that I will plot S/R with fibs and use the fib levels plotted as my take profit levels. This is the essence of "Fibonacci Strike".
Counter Trend- Same criteria applies as trend with a more conservative approach. I will use bar formations for entry. However, I will be more picky about my bar formations and look for divergence
on RSI or MACD to trade.
Exit- If I trade the 1hr charts, I will usually exit when I get three bar highs/lows counter to the direction of my trade before I close the trade. I am reluctant to say that this is a hard and fast rule because there are times when I close earlier based on market conditions. I always have a "target". On the trades that I take on 4hr TF's, I will usually hold these until target is reached. Usually the target is at the fib levels plotted on monthy or weekly TF's. I will post every one of my Fibonacci Strike Trades here. I do not take all entry opportunities. I have some preferences that I will explain as time provides.
  • Post #675
  • Quote
  • Mar 16, 2010 8:23am Mar 16, 2010 8:23am
  •  KissFan
  • Joined Jan 2008 | Status: In Fibonacci We Trust | 2,334 Posts
Quoting KissFan
Disliked
Long @ .9137.

K.I.S.S.
Ignored
Stopped for +1. I am looking for re entry on the 1 hr TF.


K.I.S.S.
  • Post #676
  • Quote
  • Mar 16, 2010 8:25am Mar 16, 2010 8:25am
  •  Bleek
  • Joined Aug 2009 | Status: All your stops are belong to us | 770 Posts
Quoting KissFan
Disliked
EUROCAD?

K.I.S.S.
Ignored
Yep!
"I made all my money by selling too soon"
  • Post #677
  • Quote
  • Mar 16, 2010 9:04am Mar 16, 2010 9:04am
  •  KissFan
  • Joined Jan 2008 | Status: In Fibonacci We Trust | 2,334 Posts
Quoting Bleek
Disliked
Yep!
Ignored
Once I spied the pin below the weekly pivot I waited for the next bar to close below the botom fib for entry. I have observed that once price closes below the 382/618 or above the 382/618 it will usually run for a little while. My "target" is always the 0/100 fib on trades like these.

K.I.S.S.
Attached Image (click to enlarge)
Click to Enlarge

Name: bleek.jpg
Size: 74 KB
  • Post #678
  • Quote
  • Mar 16, 2010 11:34am Mar 16, 2010 11:34am
  •  Matrixxdg
  • | Joined Feb 2007 | Status: Trade to Live | 369 Posts
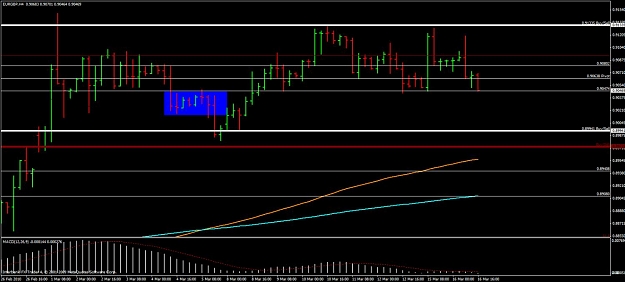
Good Stuff Kiss.... you were right on the EUR/GBP :-)
  • Post #679
  • Quote
  • Mar 16, 2010 11:40am Mar 16, 2010 11:40am
  •  KissFan
  • Joined Jan 2008 | Status: In Fibonacci We Trust | 2,334 Posts
Quoting Matrixxdg
Disliked
Good Stuff Kiss.... you were right on the EUR/GBP :-)
Ignored

This one is in a major uptrend. We might get it to break lower but it is really choppy and it would break lower into that mess to the left. I just don't want o deal with that stuff. If we could however get to .9000 then I'd be looking for longs on higher TF's.

K.I.S.S.
Attached Image (click to enlarge)
Click to Enlarge

Name: matrixxdg.jpg
Size: 102 KB
  • Post #680
  • Quote
  • Mar 16, 2010 11:55am Mar 16, 2010 11:55am
  •  KissFan
  • Joined Jan 2008 | Status: In Fibonacci We Trust | 2,334 Posts
If we break 1.5217 we should head on up without too much trouble to 1.5340 area which coincides with the 1.382 ext from last weeks range. I think that 1.5700 will be a very acheivable target from there. After last nights shake out I am more comfortable buying GU.

K.I.S.S.http://cdn.forexfactory.com/images/s...yim/rockon.gif
Attached Image (click to enlarge)
Click to Enlarge

Name: gbpusdfibstrike03162010observation.jpg
Size: 89 KB
  • Trading Journals
  • /
  • KissFan's Trading Journal
  • Reply to Thread
    • 1 3233Page 343536 66
    • 1 33Page 3435 66
0 traders viewing now
  • More
Top of Page
  • Facebook
  • Twitter
About FF
  • Mission
  • Products
  • User Guide
  • Media Kit
  • Blog
  • Contact
FF Products
  • Forums
  • Trades
  • Calendar
  • News
  • Market
  • Brokers
  • Trade Explorer
FF Website
  • Homepage
  • Search
  • Members
  • Report a Bug
Follow FF
  • Facebook
  • Twitter

FF Sister Sites:

  • Metals Mine
  • Energy EXCH
  • Crypto Craft

Forex Factory® is a brand of Fair Economy, Inc.

Terms of Service / ©2021