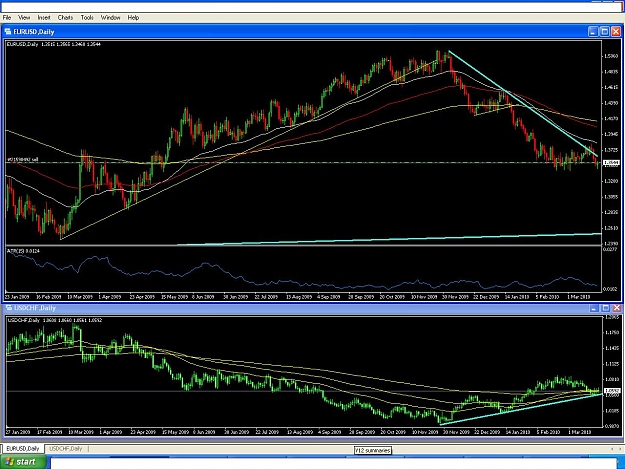
After following Jacko for some time, this is my visual representation of the method. A bit different from Jacko's technique i'm sure, but the same concept. 20, 50, 100, 200 and 365 EMA to help identify the trend. Yellow lines are the 50 fib level drawn from support and resistance points. AH becomes valuable when the market starts to chop as seen in the area marked in blue. Personally when i see indefinite breaks of support or resistance as represented in the blue area of the chart, i sit and wait for the market to pick a direction. Hope this helps some following this thread.
http://i80.photobucket.com/albums/j1...rusd_jacko.gif
http://i80.photobucket.com/albums/j1...rusd_jacko.gif