J - I thought it was the body of the candle we looked at rather than the wicks for these or do I misunderstand.
Ignored
Its the wicks or the bodies, as long as the Highs match. We don't see them often match up exactly. Some people, like myself, will give some leeway by a few pips when they don't match exactly. Like this one on the Aud/Jpy Weekly.
edit: Thanks Mike. I haven't seen to many body Highs match very often. lol
Attached Image (click to enlarge)
Indicators show the past. Price Action "Indicates" the future.
Its the wicks or the bodies, as long as the Highs match. We don't see them often match up exactly. Some people, like myself, will give some leeway by a few pips when they don't match exactly. Like this one on the Aud/Jpy Weekly.
edit: Thanks Mike. I haven't seen to many body Highs match very often. lol
Ignored
Funny you say that but actually there is something interesting. When a candle/bar closes at its very low, or closes at its very high. Meaning the high = the close, or the low = the close. There is a large tendency for price to reverse on those bars. I read it from Larry Williams, and I never really got around to much testing, but it is pretty interesting at the right places
So in forex I'm guessing this pattern doesnt appear too often? What I meant earlier by no gaps in forex making engulfing patterns more rare is just that: often in stocks I would play...
I would see an uptrend, a gap up and then a retracement down past the previous candle. Without these gaps, it seems like the formation would be relatively rare in forex?
Funny you say that but actually there is something interesting. When a candle/bar closes at its very low, or closes at its very high. Meaning the high = the close, or the low = the close. There is a large tendency for price to reverse on those bars. I read it from Larry Williams, and I never really got around to much testing, but it is pretty interesting at the right places
Mike
Ignored
That sounds cool. I've see them, high/low = close, never really thought much about them though. I'll have to take a closer look.
Indicators show the past. Price Action "Indicates" the future.
So in forex I'm guessing this pattern doesnt appear too often? What I meant earlier by no gaps in forex making engulfing patterns more rare is just that: often in stocks I would play...
I would see an uptrend, a gap up and then a retracement down past the previous candle. Without these gaps, it seems like the formation would be relatively rare in forex?
Ignored
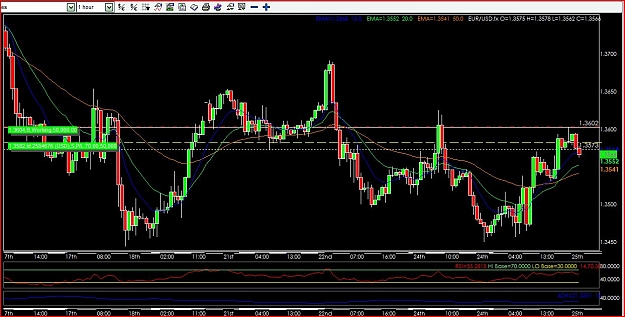
Outside bars are extremely common in forex, and no gap is need. You simply need price at some point to move higher then the previous bar and move lower then the previous bar and close near the bottom, and vice versa.
Here is a chart with a bunch of outside bars marked
Would you consider the second-to-last bar bearish engulfing, Mike? I plan to give this trade a relatively loose stop basedo nthe assumption that the engulfing formation + bounce off resistance and try to ride a decent pip move.
edit: I realize the engulfing pattern isn't at the exact R level, but looking at the level it seemed clear a rise past it had failed.
Going over old posts, or just remembering old posts, and following up on them is healthy. I think it's funny how a lot of my older posts came true, yet I didn't follow my own advice
Although this week... I have been just traveling all over the southwest of USA... I don't think I'm going back east, ever.
Ignored
you got to watch out.........with those numbers........urrhhhsss
You are making this WAY too hard, I bet you have a engineering background ggggggg.
Attached is a pic of your chart.
Attached Image
Ignored
Nice catalog sheet there
I play with those kind of sheet catalog all the day and trading as well,but with trading I'm different I like to keep it simple
I was working as a Layout designer for Siemens, doing PCB design for all kind of electronic circuits
They have licence for Menthor Graphics PADS and Zuken,but I was playing with PADS
and also I was doing signal integrity analyze and EMI/ECM design problems with HyperLynx,it was my job to reduce development and product costs,and increasing product performance
I knew it was a false breakout when the BEOB formed. That is part of what we can glean from a bar like a BEOB. I was simply watching the 85 area. Price consolidated, gave a large beob.
Best
Mike
Ignored
Hey Mike,
So, the term 'false' in false breakout is coined because price in ethe BEOB overshoots previous highs in the blue consolidation box before coming down fast, rite? (still a little slow in picking up the terms)
Hey Mike,
So, the term 'false' in false breakout is coined because price in ethe BEOB overshoots previous highs in the blue consolidation box before coming down fast, rite? (still a little slow in picking up the terms)...
Ignored
Hey CY...
if i may:
the term 'false breakout' can be used in other trading conditions (not just in the range breakout example)
it is 'false' because it moves in one direction only to reverse to the other, real direction.
for example, in a downtrend, u can plot a downsloping trendline. price sometimes breaks above the trendline, for a short time, only to move back inside the trendline in a few minutes/hours/days (depending on the timeframe)
another term is 'headfake'
u can also think of a pin bar with a long nose: the direction of the long nose (where the nose is pointing at) is the 'lie' (false break/false move)
Hey CY...
if i may:
the term 'false breakout' can be used in other trading conditions (not just in the range breakout example)
it is 'false' because it moves in one direction only to reverse to the other, real direction.
Hope this helps
Ignored
Hi SChaos,
Thanks for enlightening!
Just read your profile, hope u will one day scale the highest peak on earth!!