I had an email this week-end from a “know it all” lurker who told me I should use a “Trend Strength Indicator” to allow me to hold my positions longer! He kindly included the “Trend Strength Indicator” for me to use.
Instead of just jumping into a thread and writing the first useless piece of crap that comes into their tiny, miniscule minds, why don’t these morons read at least, some of the thread?
Why do I need something, anything, to tell me the strength of a trend when I can just look at PRICE and see it in a glance?
Anyway, because I know there are traders who make a living trading using indicators, I am always open to something which will help me squeeze a few more pips out of the market so I gave it a test drive.
I applied it to a few of my trending trades and in each case, it would have got me in much, much later and out way too early leaving lots and lots of missed pips!
I wanted to check the code to see how it determined “Trend Strength” but it is an ex4 file instead of an mq4 file and therefore locked.
I superimposed it on top of Welles Wilder’s Relative Strength Indicator and it looks like it is a “smoothed” version of it.
So, if it is a “smoothed” version, it is a SECOND derivative of PRICE and is usually based on PRICE over 14 days. Therefore, like all indicators, it is LAGGING PRICE and PRICE ACTION and, LAGGING behind the original indicator, the FIRST derivative of PRICE.
I had put this on the AUDUSD to show as an example but it was so “pathetic” and meaningless, I deleted the damned thing.
Why anyone needs this useless piece of junk is beyond me. Why do you need an indicator when you can just SIMPLY look at PRICE and PRICE ACTION?
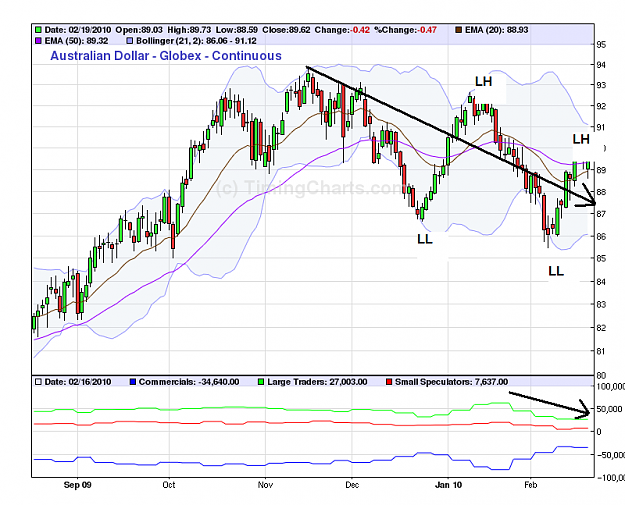
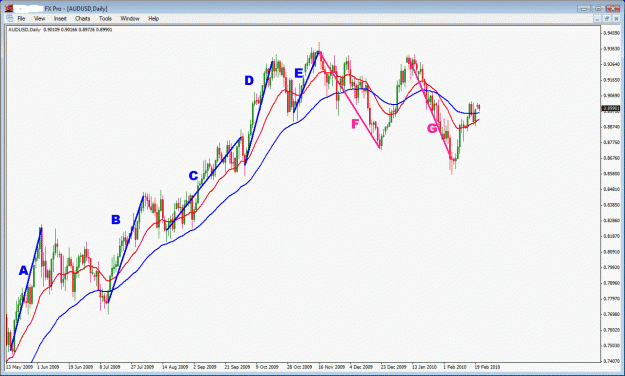
Take a glance at AUDUSD:
If PRICE continues to close higher, PRICE is trending up. The angle of PRICE making higher PRICES is MOMENTUM and, in itself, “THE” indication of trend strength (or weakness).
If you cannot see that at first glance, then just look at PRICE relative to our MAs. Is PRICE moving in parallel with them or getting nearer to them or moving away from them?
If you still cannot see Trend Strength then draw straight lines on the swings. Observe the angle of those lines.
Usually, but not always, the steeper the slope of PRICE (line) the nearer PRICE is to exhaustion.
Gann declared that a 45 degree PRICE slope was the ideal slope for steady, trending PRICES.
The slope of lines A & B are very steep, greater than 45 degrees and warn us that PRICE does not usually continue at this speed.
Line C is more gradual and basically changes into Line D where it again exhausts itself.
Line E is a short exhaustion trend.
Lines F & G, being down, will always be steeper than their “UP” counterparts due to the effect of gravity (PRICE falling).
We also know that at turning points and end of trends, PRICE usually, but not always, “peters out” (loses momentum – loses the energy driving/pushing it) which is shown by smaller bodied candles. This is not a hard and fast rule as PRICE sometimes PAUSES in a similar manner before continuing the original trend.
The RSI and this “Trend Strength” indicator is supposedly for trading trends BUT just applying this to our trendy AUDUSD would whipsaw you so badly that you would wish you had never heard of trading forex!
Again, the best indicator for ANYTHING is between your ears.
Instead of just jumping into a thread and writing the first useless piece of crap that comes into their tiny, miniscule minds, why don’t these morons read at least, some of the thread?
Why do I need something, anything, to tell me the strength of a trend when I can just look at PRICE and see it in a glance?
Anyway, because I know there are traders who make a living trading using indicators, I am always open to something which will help me squeeze a few more pips out of the market so I gave it a test drive.
I applied it to a few of my trending trades and in each case, it would have got me in much, much later and out way too early leaving lots and lots of missed pips!
I wanted to check the code to see how it determined “Trend Strength” but it is an ex4 file instead of an mq4 file and therefore locked.
I superimposed it on top of Welles Wilder’s Relative Strength Indicator and it looks like it is a “smoothed” version of it.
So, if it is a “smoothed” version, it is a SECOND derivative of PRICE and is usually based on PRICE over 14 days. Therefore, like all indicators, it is LAGGING PRICE and PRICE ACTION and, LAGGING behind the original indicator, the FIRST derivative of PRICE.
I had put this on the AUDUSD to show as an example but it was so “pathetic” and meaningless, I deleted the damned thing.
Why anyone needs this useless piece of junk is beyond me. Why do you need an indicator when you can just SIMPLY look at PRICE and PRICE ACTION?
Take a glance at AUDUSD:
If PRICE continues to close higher, PRICE is trending up. The angle of PRICE making higher PRICES is MOMENTUM and, in itself, “THE” indication of trend strength (or weakness).
If you cannot see that at first glance, then just look at PRICE relative to our MAs. Is PRICE moving in parallel with them or getting nearer to them or moving away from them?
If you still cannot see Trend Strength then draw straight lines on the swings. Observe the angle of those lines.
Usually, but not always, the steeper the slope of PRICE (line) the nearer PRICE is to exhaustion.
Gann declared that a 45 degree PRICE slope was the ideal slope for steady, trending PRICES.
The slope of lines A & B are very steep, greater than 45 degrees and warn us that PRICE does not usually continue at this speed.
Line C is more gradual and basically changes into Line D where it again exhausts itself.
Line E is a short exhaustion trend.
Lines F & G, being down, will always be steeper than their “UP” counterparts due to the effect of gravity (PRICE falling).
We also know that at turning points and end of trends, PRICE usually, but not always, “peters out” (loses momentum – loses the energy driving/pushing it) which is shown by smaller bodied candles. This is not a hard and fast rule as PRICE sometimes PAUSES in a similar manner before continuing the original trend.
The RSI and this “Trend Strength” indicator is supposedly for trading trends BUT just applying this to our trendy AUDUSD would whipsaw you so badly that you would wish you had never heard of trading forex!
Again, the best indicator for ANYTHING is between your ears.
Attached Image (click to enlarge)
15 YEARS OF PASR ON FOREX FACTORY!
1