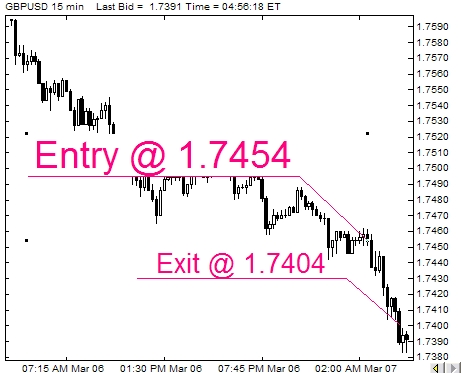
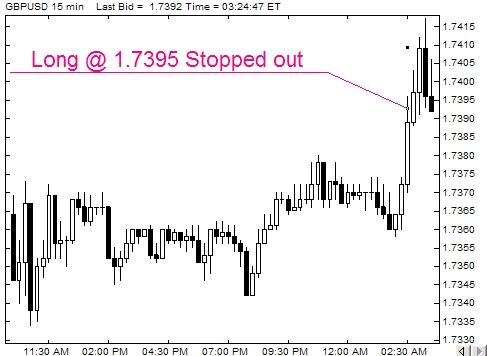
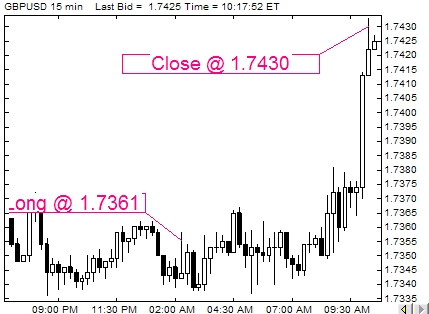
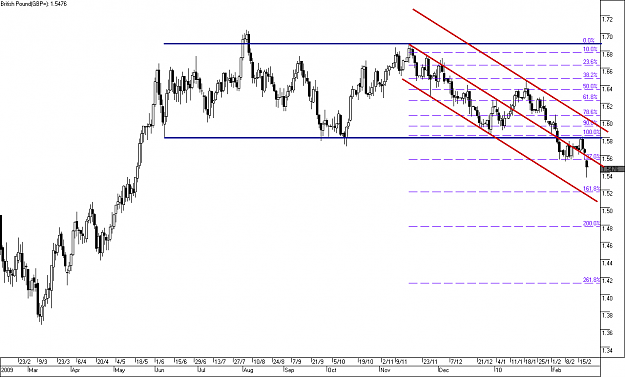
Took a long position @ 1.7588 @ 7.02am London time
Thoughts and Ideas
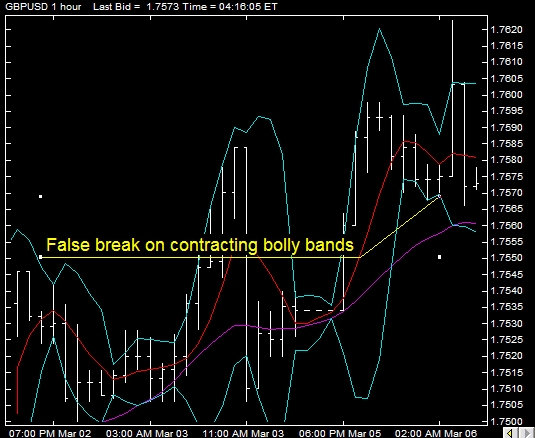
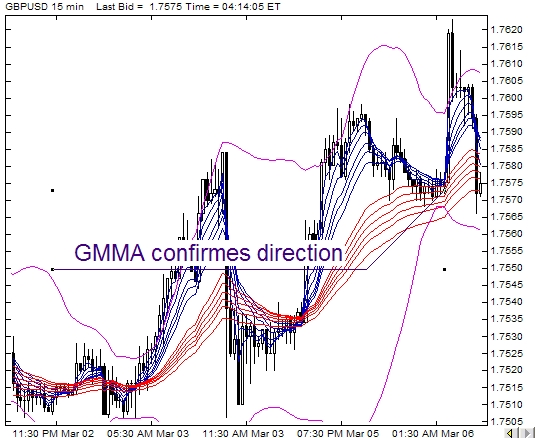
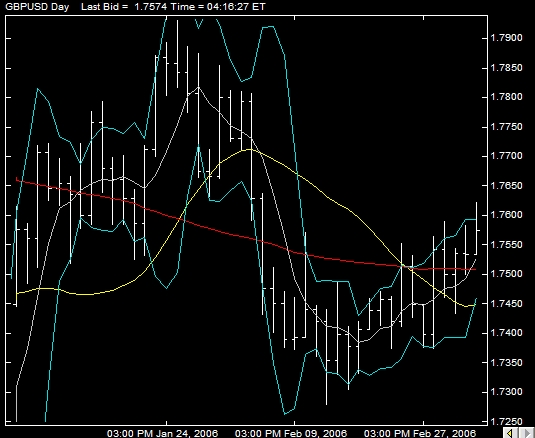
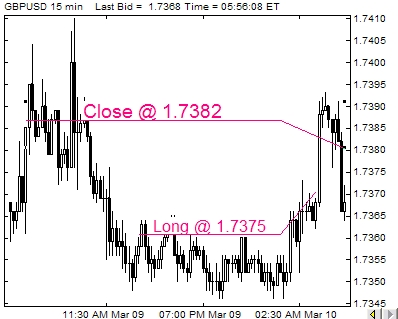
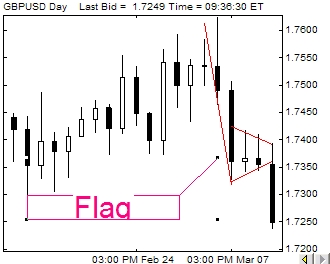
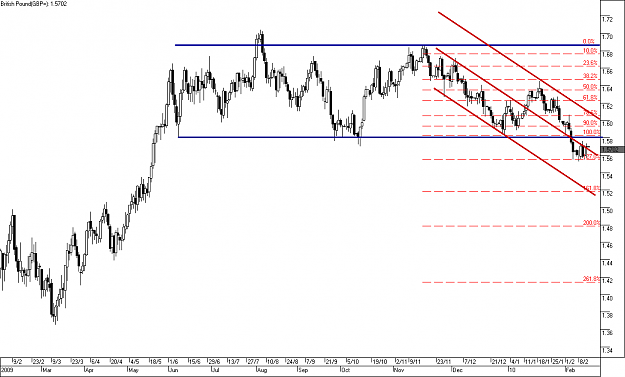
There was still momentum for long according to the day chart and the contracting bollinger bands on the 1 hour chart and the subsequent false break according to bolly rules confirms this. The GMMA was indicating a long trade and one was taken.
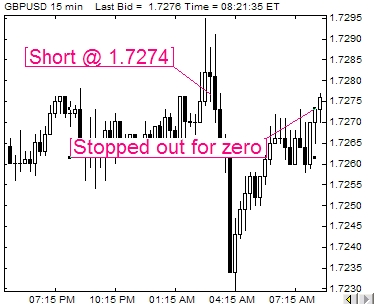
Trade went 20 points in profit and set stop loss to zero as per trading rules.
Conclusion
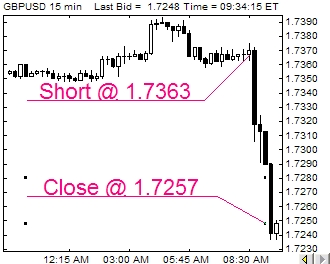
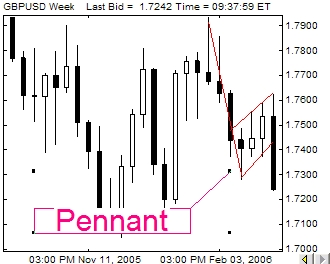
Stopped out for a zero as week chart and the relevant bollinger bands came into play forcing the long position to be short lived. Closed out for a zero point loss.
Thoughts and Ideas
There was still momentum for long according to the day chart and the contracting bollinger bands on the 1 hour chart and the subsequent false break according to bolly rules confirms this. The GMMA was indicating a long trade and one was taken.
Trade went 20 points in profit and set stop loss to zero as per trading rules.
Conclusion
Stopped out for a zero as week chart and the relevant bollinger bands came into play forcing the long position to be short lived. Closed out for a zero point loss.
Attached Images