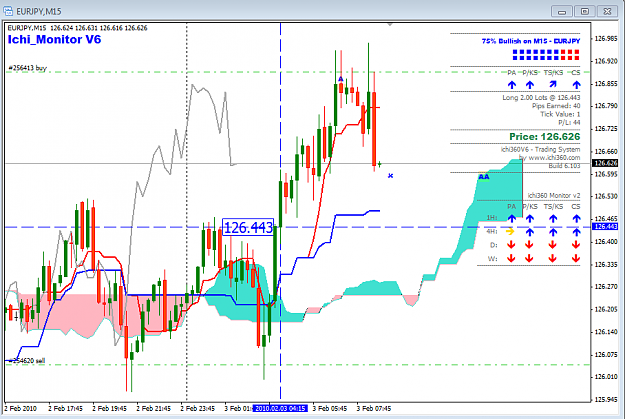
When the candle at A was formed the cloud was 26 periods ahead of the price at AA. At that time the top of the cloud was at level BB.
Price tends to return to the level BB
When the candle at A was formed the cloud was 26 periods ahead of the price at AA. At that time the top of the cloud was at level BB. Price tends to return to the level BB
This is a general observation and, no I do not have trades based on this. I only keep it in mind when I trade counter trend.
It works on the 30M as well
Ignored
How interesting! I marked up an EJ chart about an hour ago to observe this phenomena, and you are right! I marked an "A" and "AA" at that time, then calculated about where the movement would be later and marked that spot with an "X". The attached screen shot from a couple of minutes ago confirms the observation!
I will definitely keep an eye on this in the future!
Yes , but the chinkou span is still bearish, or do you just trade kumo breakouts?
Ignored
the chikou span is bearish when it is below the price curve and bullish when it is above the price curve (26 periods ago), so in this case it is bullish. now if you meant the price is above the kumo or below the kumo that is called the Chikou span cross which is different than the kumobreakout strategy I used and which had all the conditions fulfilled (the bullish kumo twist, the chikou span above price). If you noticed the green dashed lines, these are targets for profit taking based on the flat kumo levels and one of them triggered and so I was out +38 then I waited for a retrace and bounce off the kumo but that did not happen yet.
How interesting! I marked up an EJ chart about an hour ago to observe this phenomena, and you are right! I marked an "A" and "AA" at that time, then calculated about where the movement would be later and marked that spot with an "X". The attached screen shot from a couple of minutes ago confirms the observation!
I will definitely keep an eye on this in the future!
Ed
Ignored
Hi, there might be some repetitive pattern there, but if you notice there is a wide diversion between the TS and a flat KS, this means that the price is not at equilibrium and will tend to come back to the base line which is the Kijun sen, so the retrace is more often than not toward the KS, now if the BB line happens to be in the way then yes you will observe price retrace to that line.
PS. in your case and if you were expecting price to revisit the BB line (or AA in your chart), should you not have sold instead of bought at point A?
How interesting! I marked up an EJ chart about an hour ago to observe this phenomena, and you are right! I marked an "A" and "AA" at that time, then calculated about where the movement would be later and marked that spot with an "X". The attached screen shot from a couple of minutes ago confirms the observation!
I will definitely keep an eye on this in the future!
Ed
Ignored
Hi would you please attache your ichimoku indicator? your indicator version have difference to my version. Regards
PS. in your case and if you were expecting price to revisit the BB line (or AA in your chart), should you not have sold instead of bought at point A?
Ignored
Those two existing trades on my chart are hedges I had in place before looking into the phenomena we are discussing. But, to answer your question, in a word - Yes.
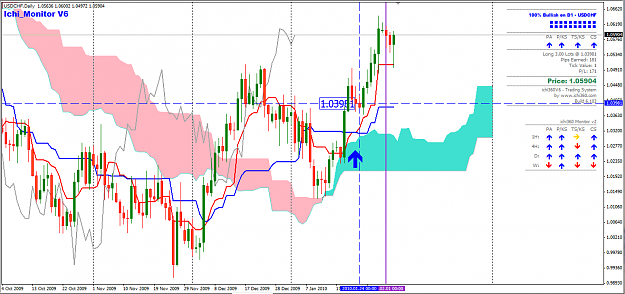
I posted this setup on 27-01-2010. is any one in this trade? TK/KS/kumo cross on 4hr and daily above the cloud, then price crossing the KS though below the cloud on weekly.
118 pips already. How far do you think It will go?
Hi, there might be some repetitive pattern there, but if you notice there is a wide diversion between the TS and a flat KS, this means that the price is not at equilibrium and will tend to come back to the base line which is the Kijun sen, so the retrace is more often than not toward the KS, now if the BB line happens to be in the way then yes you will observe price retrace to that line.
Ignored
lbtrader,
Thank you for the feedback. What I noticed was that sometimes the price would turn to the kijun but before kijun was reached it went back to where it came from and then I found that there was some correlation between the BB line and the turning point before the kijun - but like all things Ichi, it is not cast in stone.
I posted this setup on 27-01-2010. is any one in this trade? TK/KS/kumo cross on 4hr and daily above the cloud, then price crossing the KS though below the cloud on weekly.
118 pips already. How far do you think It will go?
Ignored
if the weekly confirms a bullish TS/KS cross then another 400 pips to the kumo.
lbtrader,
Thank you for the feedback. What I noticed was that sometimes the price would turn to the kijun but before kijun was reached it went back to where it came from and then I found that there was some correlation between the BB line and the turning point before the kijun - but like all things Ichi, it is not cast in stone.
Ignored
if that should happen, then go to higher TF and see why the move did not reach the KS, it might be a support or resistance level or a kumo or KS at the higher TF. remember, the senkou span A is the median point between TS and KS 17.5 periods in the past shifted 26 periods forward, so there is some sense in the BB line. remember also the kumo shadows.
I posted this setup on 27-01-2010. is any one in this trade? TK/KS/kumo cross on 4hr and daily above the cloud, then price crossing the KS though below the cloud on weekly.
118 pips already. How far do you think It will go?
Ignored
Don't know how far it will keep going, but I wish I had paid close attention to the Daily back on Jan 24th, when it clearly indicated we should go LONG at 1.03981.
Shoot... I have to be more observant in the future!
if that should happen, then go to higher TF and see why the move did not reach the KS, it might be a support or resistance level or a kumo or KS at the higher TF. remember, the senkou span A is the median point between TS and KS 17.5 periods in the past shifted 26 periods forward, so there is some sense in the BB line. remember also the kumo shadows.
Ignored
Thank you - I will look again at the kumo shadows in more detail.
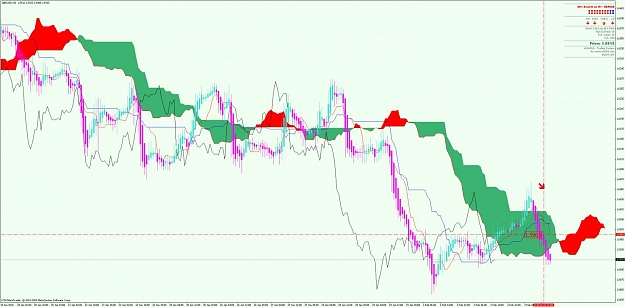
guys what do u think about this breakout ? neutral TsKs cross , TP can be last support
Ignored
Looking at this pair (GBPUSD), I see that the price is in the cloud on the Weekly but appears to be ready to break out on the low side.
On the Daily, price has clearly broken out downwards, and the H4 and H1 charts show current downward price action. In my humble opinion, it would be safe to short it for a while.
BUT, don't forget the fact that the NFP report is due to be released Friday morning (US time), and that *could* throw a wrench into the works.
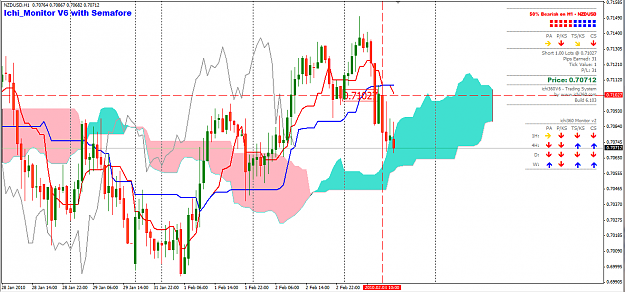
does this look like a good long setup? price is at kumo edge and stochastic looks oversold.
Ignored
Did I hear you think about going "Long" on the NZDUSD? While I am certainly no expert at this game, in taking a good close look at this H1 chart I see the price diving down into the cloud right after a fairly strong short indication.
Examining the Weekly, I see what may be a forthcoming long-term trend reversal to downwards, and the Daily is also suggesting price weakness. Based on all of this, I personally would not go long at this point. That's my humble opinion of the situation, but I'd love to hear others opinions and interpretations.