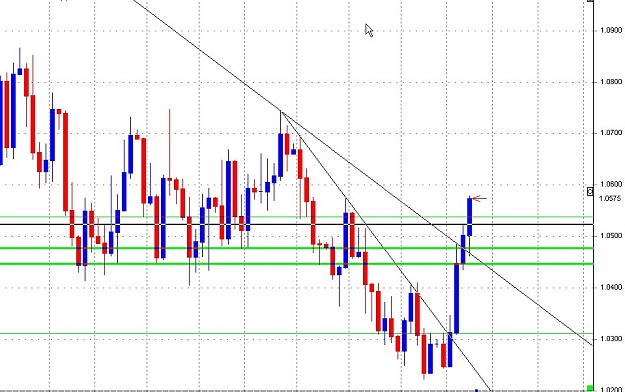
If you are wondering about the USD/CAD behavior yesterday, please take a look at the weekly chart and observe. The area of 1.0446 and 1.0449 are the lows for two candles of the weekly chart, the market has a good reason to find support at this area specially after breaking the inner and outer TL on the daily, and usually after we break the TL we come back to confirm support at the back side of the TL, and that was exactly what the CADI did. There is a resistance at the area of 1.0590-1.0594, if we break above, clean break the target will be 1.0745.
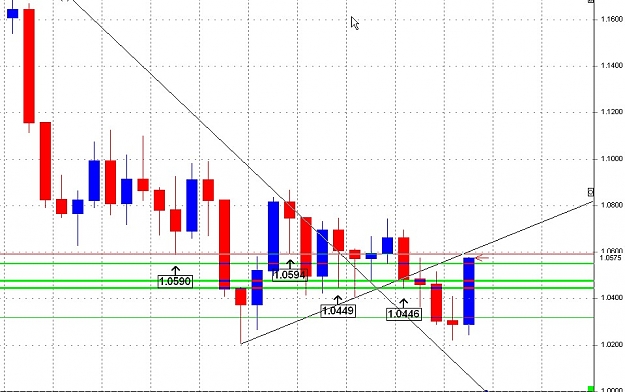
Attached Image (click to enlarge)
Attached Image (click to enlarge)