1hr chart, lots of upper wicks at 6275 where market profile also showing potential large vol resistence.
Ignored
Indeed. I've been mentioning the 6273 level a few times. Old Fibonacci level (end of June high, 8 July low) that's been in play ever since. Check a daily chart and note how many times it's been daily high/low. Was also pivot for the mid December consolidation after the post NFP drop.
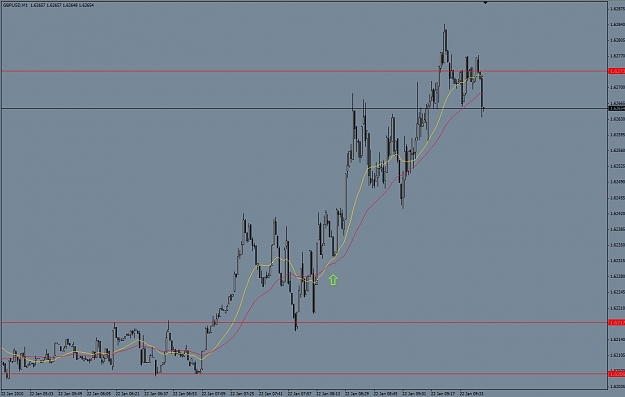
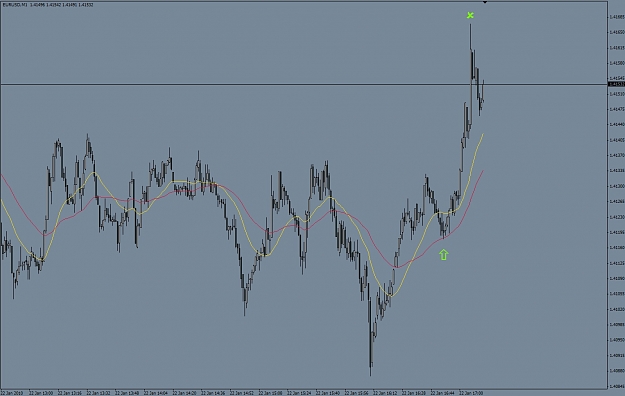
For those of you uncomfortable with buying at levels where price is seemingly moving in the wrong direction, 30 and 60 1min LWMAs may be an alternative.
Wait until the MAs have crossed and are sloping in the right direction, and buy on a pullback to the 30 period MA (at least).
Also works well when getting out of a congested area when there's a bit of a battle or dealer stop chasing going on around a level.
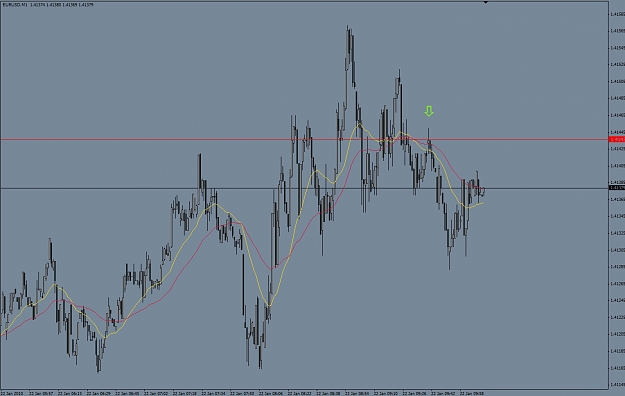
And it would have given a nice short in cable after 6273 held...
Indeed. I've been mentioning the 6273 level a few times. Old Fibonacci level (end of June high, 8 July low) that's been in play ever since. Check a daily chart and note how many times it's been daily high/low. Was also pivot for the mid December consolidation after the post NFP drop.
Ignored
Darnit.....I keep forgetting about this level.....it would certainly have helped me to book those profits earlier and then go short earlier too......I've just closed my short after the news spike to the days open level at 6193......re-selling the retrace to the DP was a "news trade" option that I've passed on as I'm going out soon and have already exceeded my daily quota....I'll post a chart before I go....
Darnit.....I keep forgetting about this level.....it would certainly have helped me to book those profits earlier and then go short earlier too......I've just closed my short after the news spike to the days open level at 6193......re-selling the retrace to the DP was a "news trade" option that I've passed on as I'm going out soon and have already exceeded my daily quota....I'll post a chart before I go....
Ignored
Well done! I always have those fib levels on my charts...
1hr chart, lots of upper wicks at 6275 where market profile also showing potential large vol resistence.
Ignored
I ended up doing an hour or two painting so that the guys here will finish and don't have to come back Monday. Mrs V got a bit of the move (entry as per 1 of Islanders sell areas in above post) but exited pre news.
Topic for discussion? Yesterday and today the immediate pre-news trade gave the direction of the news move. Obviously this doesn't work all the time but do you guys have any idea how often?
|
Joined Sep 2006
|
Status: BengalTrader
|175 Posts
awesome trading islander, me personally i took the break south of the 6250 level about 5 min or so before news time and closed it at the 25 level after seeing some stalling on the 1 min chart before news, then did a risky entry after news entering the break below 6200 and exited at 90 level, pretty much caught the bottom, but thats a littl too risky for my taste.
If you don't mind me asking, what is your daily quota trading this pair?
For those of you uncomfortable with buying at levels where price is seemingly moving in the wrong direction, 30 and 60 1min LWMAs may be an alternative.
Wait until the MAs have crossed and are sloping in the right direction, and buy on a pullback to the 30 period MA (at least).
Also works well when getting out of a congested area when there's a bit of a battle or dealer stop chasing going on around a level.
And it would have given a nice short in cable after 6273 held...
Ignored
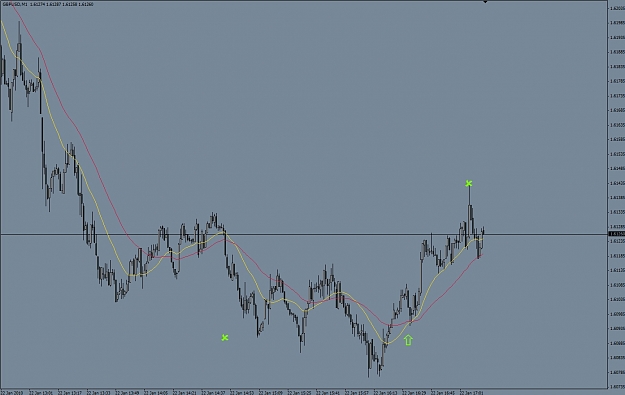
Some of our trade entries, on 1 minute the 2nd lower high/higher low. See Islanders 1 min chart for his first sell arrow.
Also where 5 min candle and 1 min entry agree. See 8.40 shooting star and 8.44 1 min entry, again this is the first sell per Islanders chart above.
I ended up doing an hour or two painting so that the guys here will finish and don't have to come back Monday. Mrs V got a bit of the move (entry as per 1 of Islanders sell areas in above post) but exited pre news.
Topic for discussion? Yesterday and today the immediate pre-news trade gave the direction of the news move. Obviously this doesn't work all the time but do you guys have any idea how often?
Ignored
Interesting question. Unlike in the equities markets, insider trading is not unlawful, and some people get hold of the data or have research staff who are good at estimating them. Remember Soros had a 'fly on the wall' inside when betting against BoE. I once talked to a trader who had done some statistical work around this for the NFP. The idea was that if the last 15m candle before 8.30am EST was long but not too long then one could enter in the direction of the candle with a certain stop.
Interesting question. Unlike in the equities markets, insider trading is not unlawful, and some people get hold of the data or have research staff who are good at estimating them. Remember Soros had a 'fly on the wall' inside when betting against BoE. I once talked to a trader who had done some statistical work around this for the NFP. The idea was that if the last 15m candle before 8.30am EST was long but not too long then one could enter in the direction of the candle with a certain stop.
Any other thoughts?
Ignored
When I news traded with a small group, the opinion was that the Euro news was generally well leaked and thus the release not worth trading, whereas the British news was better controlled and thus more liable to be out of line with expectations and give immediatly tradeable moves.
I suppose the only way is if in a trade say 30 mins before and up to either take partial profits and let balance run or let whole position run and keep track of results over a period.
What a great short trade from mid morning.....plenty of signals and once the fall started the 1 min 30 ema would have guided you to loads of pips.....pity I was out!
Its now looking as if the 6085 level will hold for a retrace and after the ~200 pip fall I would expect a minimum of a 50 pip bounce with a 50% retrace possible.....TWT
However, I've finished for the week, back for Mondays early action - I wish everyone a good weekend....
I suppose the only way is if in a trade say 30 mins before and up to either take partial profits and let balance run or let whole position run and keep track of results over a period.
Ignored
There's also the game of fading the initial moves. Dealers use the thin liquidity around news time to take out orders. NFP is notorious for that, Last time, for example, in the Euro it was up to 4410-15 then down to 4300, and then up again. Works similarly around other big news releases.
There's also the game of fading the initial moves. Dealers use the thin liquidity around news time to take out orders. NFP is notorious for that, Last time, for example, in the Euro it was up to 4410-15 then down to 4300, and then up again. Works similarly around other big news releases.
Ignored
Sure, just want to stress that this discussion would be for UK news events only. Probably not for interest rate news but the run of the mill items like this morning.
Sure, just want to stress that this discussion would be for UK news events only. Probably not for interest rate news but the run of the mill items like this morning.
Cheers guys see you Monday.
Ignored
Don't you think that this morning's news, when cable went down to 6191 and then up, was an example of what I suggested and could have been faded?
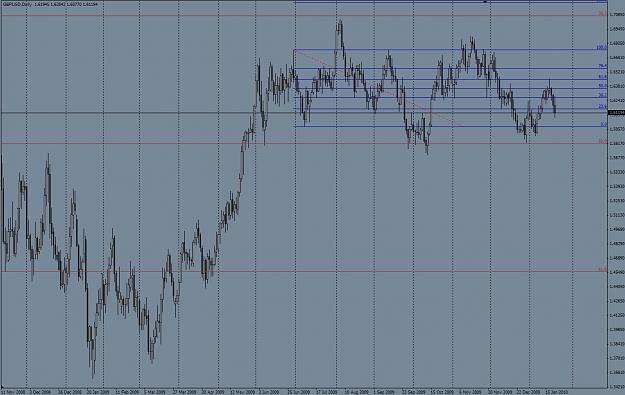
Here are the Fibonacci levels I keep on my daily chart.
The blue is the range since summer. High end of June, low 8 July. Capped the latest medium term up move at the 61.8% level 6453. Capped today's up move at the 38.2% level at 6273.
The brown is the January 85 low to the November 07 high. I've taken some good trades off those levels.