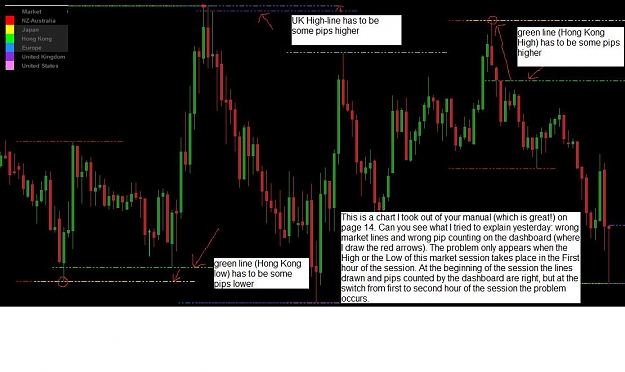
Thanks for your video and your trade example. So here I try again to post a picture. It is a picture from your nice manual and I think it shows the bug I tried to explain in my last post.
As the Trix indicator is not part of the dashbaoard, I haven't put a lot of effort into it while getting v3 dashboard out. Hope to get the thv minis, coral and trix indicators all sorted very soon
When I saw the Craig's videos, he added H1 and H4 line on the M15 chart. Anyone know what do those H1 and H4 lines use for? any idea for advantage in trading? http://cdn.forexfactory.com/images/s...m/thinking.gif
Yeah, I forgot he didn't put that into the template. But, the dashboard gives you all of the info. Maybe he will post the template. Sorry for the mis-information.
Note: still a bug for 4 digit brokers ... sorry about that ... will fix within next couple of weeks
Ignored
My mistake. I downloaded all the files the other day and forgot about it until today. Must have been asleep. Oh well, I got my 30 pips for the day and am gonna relax with a cold one.
Thanks for the great videos and charts Stratman. They really help.
Thanks for investigating that for me. Your picture is worth more than 1000 words. I will look at the code and see what I have wrong.
People, thanks for your patience ... particularly if you've purchased the dashboard. It's great that no-one has flamed me for the bugs even though I might deserve it
Thanks for your video and your trade example. So here I try again to post a picture. It is a picture from your nice manual and I think it shows the bug I tried to explain in my last post.
I was directed to this strategy by zax1150. This is the documentation from the VT2.0 manual I used to code my version of this.
Overview
The VT-Chaos Fractal Trading System uses the Chaos Fractals indicator which consists of Up Fractals and a Down Fractals. This trading system based on a very small fraction of the trading logic described by Bill Williams, Ph.D., in his Chaos-based trading methods. According to Bill Williams, an "up fractal" is defined as a middle bar with two lower highs on each side of it; A "down fractal" is defined as a middle bar with two higher lows on each side of it.
A Buy signal is generated when the Close price crosses above the most recent Up Fractal. A Sell signal is generated when the Close price crosses below the most recent Down Fractal.
This trading system can be used in Recommendation Only mode to generate alerts and, if you choose, in Auto-Trade mode to automatically request orders based on its signals and its Trading Enabled output variables (OpenBuy, CloseBuy, OpenSell, and CloseSell). System Outputs and Signals Logic
The VT-Chaos Fractal Trading System consists of the following output variables and display parameters:
•The Up Fractals levels are displayed in the Price Frame as small blue dots.
•The highest High value of the Up Fractals are displayed in the Price Frame as large dark blue dots. These dots are displayed over the 3rd bar of the fractal only after the fractal has been identified on its 5th bar.
•The Down Fractals levels are displayed in the Price Frame as small red dots. These dots are displayed under the 3rd bar of the fractal only after the fractal has been identified on its 5th bar.
•The lowest Low value of the Down Fractals are displayed in the Price Frame as large dark red dots.
•When the Close price crosses above the most recent Up Fractal and until the Close price crosses below the most recent Down Fractal, the Trend Frame displays a blue background and a yellow bull symbol along with a vertical blue line when a Buy signal (see above criteria) is generated.
•When the Close price crosses below the most recent Down Fractal and until the Close price crosses above the most recent Up Fractal, the Trend Frame displays a red background and a yellow bear symbol along with a vertical red line when a Sell signal (see above criteria) is generated.
•When a Buy signal (see above criteria) is generated, a blue arrow graphic displays in the chart window and the message, "Long Signal Detected! Close price has crossed above an Up Fractal." displays in the Trading Activity window; a standard audio alert will also play. If Auto-Trade mode is enabled, this is the condition that will trigger automated trading actions based on the logic of the OpenBuy and CloseSell output variables and the parameters defined in the Trading System Properties window's Trading Parameters tab.
•When a Sell signal (see above criteria) is generated, a red arrow graphic displays in the chart window and the message, "Short Signal Detected! Close price has crossed below a Down Fractal." displays in the Trading Activity window; a standard audio alert will also play. If Auto-Trade mode is enabled, this is the condition that will trigger automated trading actions based on the logic of the OpenSell and CloseBuy output variables and the parameters defined in the Trading System Properties window's Trading Parameters tab.
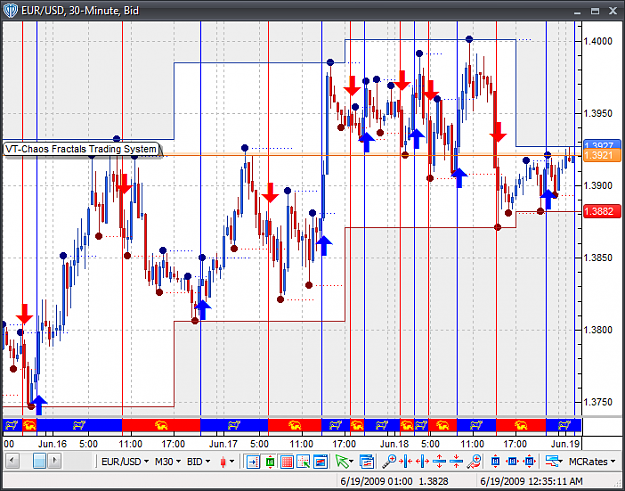
Below is a screenshot that shows the VT-Fractal Trading System attached to a chart window using its default parameters...
When 'scalping' or intraday trading, the Highs and Lows of the previous H4 and H1 candles can be used as support and resistance lines.
I'm in a GBPUSD trade at this moment based on a break of both previous candle H4/H1 lows. At the same time, I got a fractal breakout signal on H1 to go short and all thv rules were met on M1-M15.
Also note that I would not normally trade until 40 pips range for the day, but my visitors are returning in a couple of hours and I want to get another trade example here on the thread today.
Note: In the following picture, more candles have formed on H1/H4 since I started the trade ie the white lines have moved since I started the trade.
The H1/H4 previous lows were where the yellow horizontal line is. I took the trade at the break of this line when I got a H1 fractal alert (2x H1 bars prior).
My stop was put at 20 pips which is at 1.6170 ie just above the compass and previous H1 high. (Also M15/M30 fractal resistance)
When I saw the Craig's videos, he added H1 and H4 line on the M15 chart. Anyone know what do those H1 and H4 lines use for? any idea for advantage in trading? http://cdn.forexfactory.com/images/s...m/thinking.gif
My home has 10 people here right now (including children) and so very hard to get time to trade
I want to give you guys as many trade examples as possible ... but this week will be difficult. My visitors are here until the end of the weekend.
Right now, I get little windows of time to post to this thread and answer your questions on skype and my email. One of you even phoned me (landline) from France today
Please be patient until I can get into a better routine. Note that my kids are still on holiday from school for a few more weeks but having the visitors gone will help a bit.
EDIT: Just after this, price came back to the open (of the day) and stalled there. I decided to close the trade with a 4 pip loss rather than continue risking my capital for a max of 10-15 pips ie if price did continue to fall it's likely that it would stall at the daily pivot again.
This GU trade broke one of my trading rules ie don't trade until the daily range has made at least 40 pips. My daily range starts when New York closes (5pm) but my pivots start at GMT midnight.
Sooo ... I started the trade just after New York close (left-hand yellow circle) but before the pivots got calculated. Now I'm in this trade (short) with price bouncing off the daily pivot ... not good trading.
What I should have done was take profit just before the daily pivot ie +10 pips profit ... note that the market gave me 2 opportunities
Anyway, I want to show as many of my trades as possible ... good and bad to help you learn.
Feel free to post your trades here (using thv or dashboard) .. so we can all learn from your success (and failures )
Hi Statman. You may be the one that allows me to trade profitably with this system. My hat goes off to you here in Canada. I just wanted to mention one thing. I have some writing that is blocked or cluttered on my screen. How would I go about adjust it? I know you are very busy, so I don't expect a fast reply. Cheers! hkev
If the trading week normally starts Sunday GMT 22:00 and ends Friday at GMT 22:00 (btw this matches 5pm New York) ... why do brokers not have a platform with a server time set to GMT-2?
It makes so much sense for a trading day to run 5pm-5pm New York ie No short candles over the weekend ie most brokers stop ticks at Fri 5pm New York and restart them sunday at 5pm New York.
I find this fascinating as daily pivots could be calculated around this as well?
I secretly wonder if institutional brokers use GMT-2 and we retail traders are getting second best
If anyone knows of a metatrader platform with server time GMT-2, please let me know ... I want to test drive such a beast!