DislikedHi Guys,
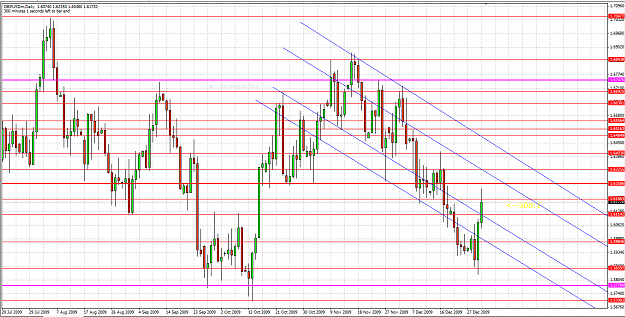
I am trading daily PB's. I am having a bit of trouble "trading with the trend". If I am looking at the daily chart and price is in an upwards trend, but is, for example, downwards on the weely chart. What would I define as the trend to "trade with"?
Another problem is that I think I am putting too many s&r lines on my charts, resuting in me taking PB set-ups off weaker s&r lines. How can I dilute these to show the best? Is there a point where there are too many s&r lines on a chart?
All help appreciated.Ignored
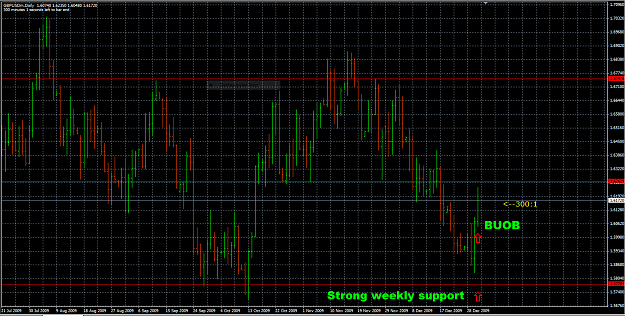
In the same way, start by placing S/R on the time frame one step above the time frame you trade on, that is, if you trade daily bars, go to a weekly time frame and zoom out a bit and place your lines in the most relevant locations. Then you can of course "fine tune" them on your trading time frame to a best fit for recent price action and maybe even add a line if you see an obvious level that didn't show on the weekly.
Just my 2