DislikedNM,
what are those MAs on your charts and how do you use them?
thksIgnored
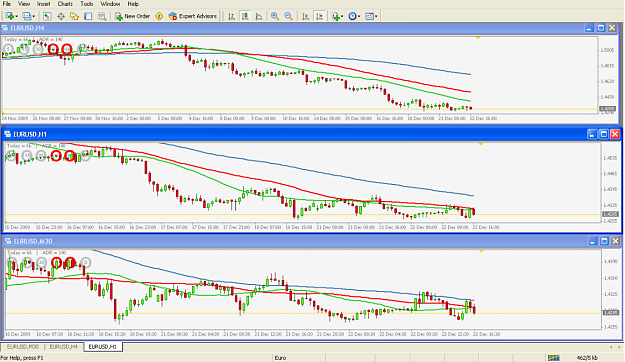
Those MA lines are the 3o, 50 and 100 SMA (on the close), they are used to help identify a trending market, and to help you determine the health and condition of the trend.. Price should to be harmonically swinging back to around the 30 and 50 MA with each retracement, or near that area anyway.
You can tell the strength and condition by how deep the retracements are digging into the MA lines, PA may start swinging back to the 30MA for a few swings, then into the 50, then into the 100 meaning it may be losing momentum. Or if it does not come any near the MA's then perhaps it may have to much momentum and it could snap back with the same kind of momentum.
They are not used a crossover system, in fact you do not want to see them crossing each other. They can really tell you alot about the trend itself. I use them all the time.
--NM