that weekly volume is the HIGHEST since the inception of the dx ... yet all over news ' dollar bearish .. dollar collapse' total bullshit . I see news like that and laugh .....
another channel i drew on s&p emini after market opened. see how it is respected all day. 1111 horizontal line is based on globex premarket action which is one of my favourite indications. i emphasize it all over again- vsa is about watching markets for thousands of hours and getting a feeling for it.
just something easily i wanted to show you. in such occassions you can assume that the excessive volume is not buying but a buying climax.
Ignored
Hmm
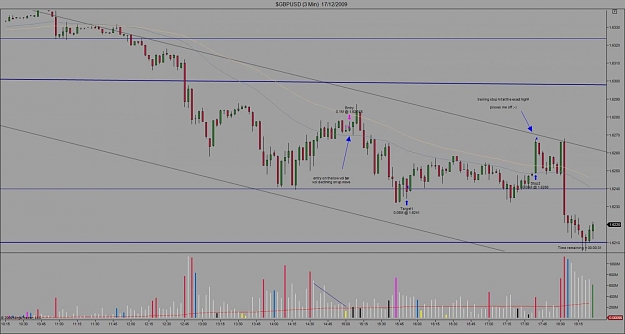
i think overall you have true. but in one thing you missunderstand that High Volume up bar.
I think .this bar that you marked is Effort by SmartMoney to go up (This is kind of principle- up bar closing on the high with high volume agaist Resistance is not weakness but strength that you missunderstand i think ) BUT Next bars tell us that there is so much SUPPLY (that BreakEvent ppls that was going long and now covering their position as you also told thats true) so Effort vs results was still too much supply so price then go lower.
but i was point out that bar on high volume was strong bar not weak bar ; )
Joined May 2008
|
Status: has long shorts
|2,584 Posts
i politely have to disagree, just because of the simple fact that the amount of volume is pretty excessive into a level which has shown weakness a few bars before and the overall very weak picture and very weak rallies. i prefer looking for an effort to rise in an upchannel or at least with other signs of strength behind us and such occasions, like we see here are leading to drops most of the time.
if we had slightly higher volume on that bar i might have agreed that this really was a true effort to rise but in that case, no way. market does not just suddenly switch it's bias and shows strength without anything significantly behind us like a selling climax, which we had none...just a bullsh*t rally
Hmm
i think overall you have true. but in one thing you missunderstand that High Volume up bar.
I think .this bar that you marked is Effort by SmartMoney to go up (This is kind of principle- up bar closing on the high with high volume agaist Resistance is not weakness but strength that you missunderstand i think ) BUT Next bars tell us that there is so much SUPPLY (that BreakEvent ppls that was going long and now covering their position as you also told thats true) so Effort vs results was still too much supply so price then go lower.
the DX shows very High Volume on a fairly low spread up bar. The weekly EUR/USD chart shows very high volume on a sizable down bar ( last weeks )
The pros must be selling the Euro and buying the USD, slowly accumulating maybe because we don't see a lot of upward movement on the DX but alot of volume. Does this sound right?
Joined May 2008
|
Status: has long shorts
|2,584 Posts
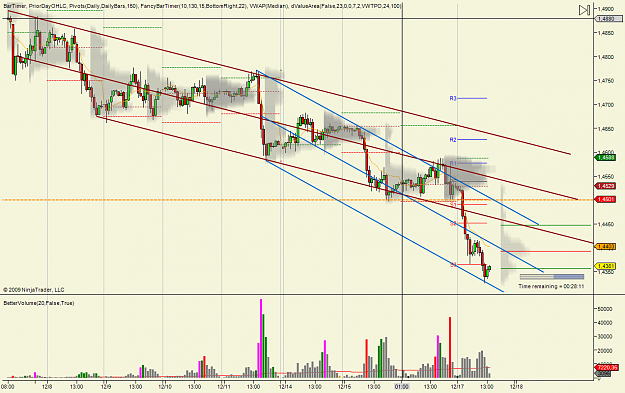
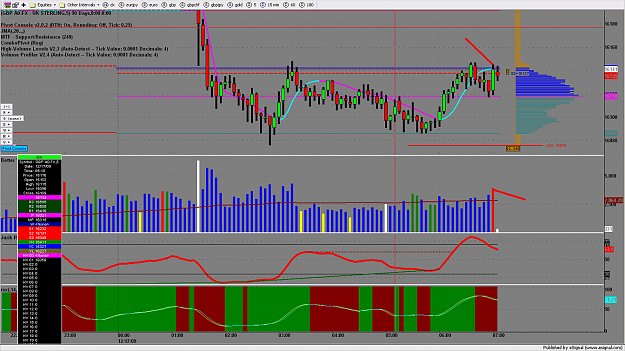
after the anticipated break of the channel low, eu formed a new, steeper channel about 11 hours ago.
see how price fails at the channel supply line and gets pushed down to the demand line. bears are clearly in control and downside momentum has increased if you compare the steepness of the two channels.
channels define clear trading ranges and reasonable entrypoints ad targets. see how eur stalled at the channel demand line.
Joined Apr 2007
|
Status: HARD SHYT SCUBA TRADER
|20,886 Posts
are you for real ?
DR G is the master of vsa and my mentor ..
what do you really know of vsa .. and why are you posting in this forum ... you are completely wrong......
go back and read master the markets 20 times , and trade with 90% accuracy and then come tell the guy that really was why this thread started how to trade vsa
He taught me .. i passed it on to Shamus and now we have guys like you telling us how to trade vsa .... what a joke.
Hmm
i think overall you have true. but in one thing you missunderstand that High Volume up bar.
I think .this bar that you marked is Effort by SmartMoney to go up (This is kind of principle- up bar closing on the high with high volume agaist Resistance is not weakness but strength that you missunderstand i think ) BUT Next bars tell us that there is so much SUPPLY (that BreakEvent ppls that was going long and now covering their position as you also told thats true) so Effort vs results was still too much supply so price then go lower.
Man, some great educational posts yesterday. Thank you.
Dr. G. or Malcolmb, if I may ask a question just to make sure I am understanding. Do selling/buying climax most often happen after a break down of a supply line or demand line and there you will also have a change in sentiment. just as in the GU yesterday.
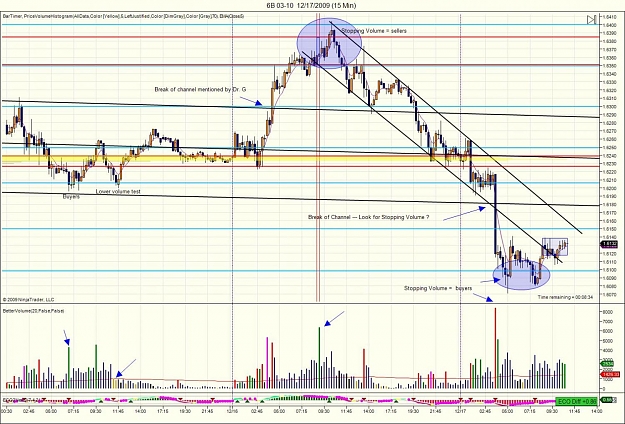
This is 15 min GU. From Dr. Gs posts and from observation it seems like the reversal stopping volume or buying/ selling climaxs will come after abreak of a channel. Yesterday you posted a chart before FOMC that background showed buyers and ofcourse you were right....pop goes up, a break of a previous trading channel. Then bam here comes the sellers pushing back into previous channel. Finds the channel again, drops even lower out of the old channel and then here comes the buyers. I realize over all this is a weak market.
After breaks of these channels, should we always look for stopping volume or climaxes?