Hi Bemac, I have been observing divergence along with this method to see if it could help me get a better entry and avoid fake-outs. I've suffered several fake-outs with the channel breaking one way just enough to get me in and then reversing and going the other way. Eh, such is life, I make it back and then some on the other end (usually), but if I could feel more confident about a channel breach, all the better right?
So anywho, I've been watching divergence with several oscillators and settled on the basic momentum one to spot divergence or even differing price versus momentum levels. PLEASE let me know if I've gotten way off tangent from the original purpose of this thread and I will post no more on this subject, only the fib channels (and accept my appologies).
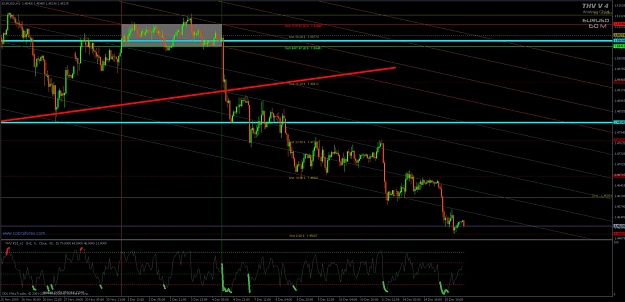
Here are two charts, the first is a 15m from today showing the momentum oscillator on the bottom (I made it big for this explanation), and the second chart is the exact same chart except instead of candlesticks it is the simple line chart. I find it easier to spot anomalies with just the line chart when comparing to the momentum (I took this trade BTW):
The area I circled shows the price moving higher while the momentum continues lower. I am interested in your thoughts...I've just started watching this in conjunction so this might mean nothing at all in relation to the channel breakout, and this is sort of a bad example since it didn't do a fake-out long, but if it had I wouldn't have taken it because the momentum was showing down.
Mike
So anywho, I've been watching divergence with several oscillators and settled on the basic momentum one to spot divergence or even differing price versus momentum levels. PLEASE let me know if I've gotten way off tangent from the original purpose of this thread and I will post no more on this subject, only the fib channels (and accept my appologies).
Here are two charts, the first is a 15m from today showing the momentum oscillator on the bottom (I made it big for this explanation), and the second chart is the exact same chart except instead of candlesticks it is the simple line chart. I find it easier to spot anomalies with just the line chart when comparing to the momentum (I took this trade BTW):
Attached Image (click to enlarge)
Attached Image (click to enlarge)
The area I circled shows the price moving higher while the momentum continues lower. I am interested in your thoughts...I've just started watching this in conjunction so this might mean nothing at all in relation to the channel breakout, and this is sort of a bad example since it didn't do a fake-out long, but if it had I wouldn't have taken it because the momentum was showing down.
Mike