Joined May 2008
|
Status: has long shorts
|2,584 Posts
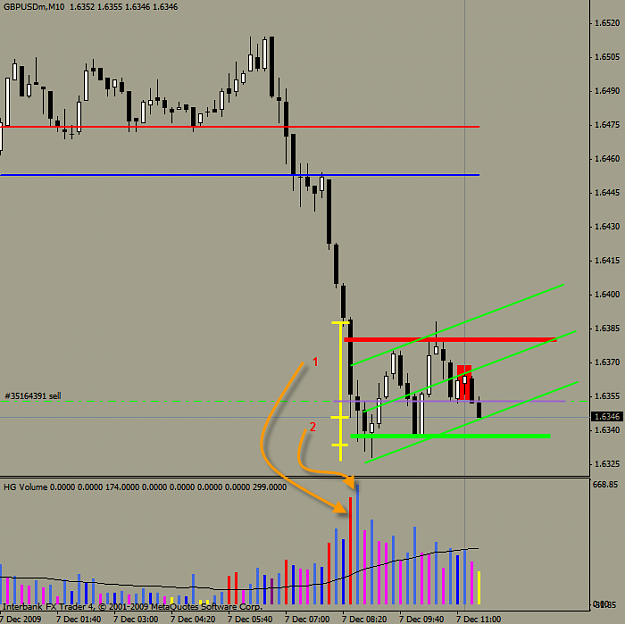
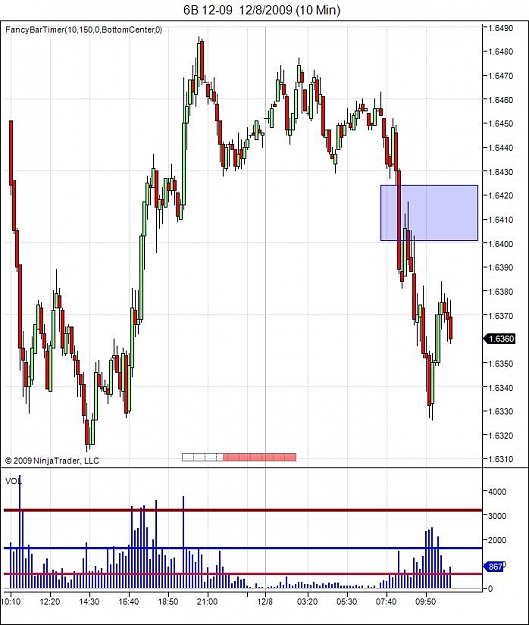
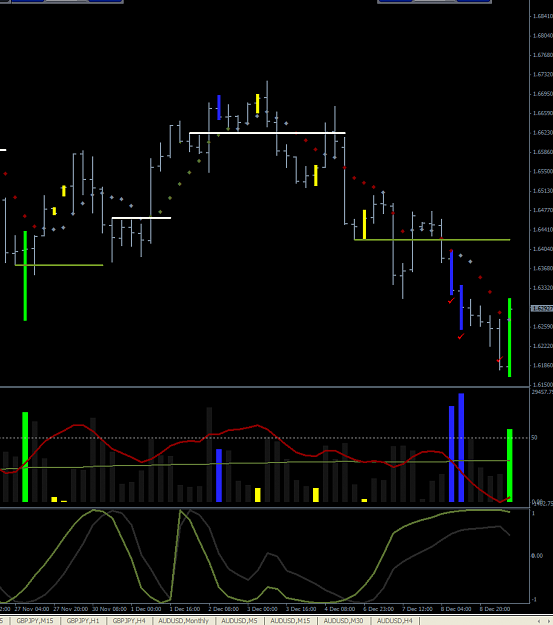
i dont know how the trade played out since i am only referring to your screenshot. shorting here imho is a bad idea. look behind: we saw volume stepping in and the result is a slight turnaround of the price. now we try to go down but the volume compared to the vol on the previous downbars is pretty tiny. see the little trendchannel which developed here. you entered in the middle, so your risk is 50% to the upside and 50% to the downside. we want to reduce our risk...
see the things i have marked o nthe chart. 1= the wide spread downbar indicating potential selling climax. voluem pretty high. bar 2 has even higher volume but compare the progress the bar made ot the previous bar. what do you see? it only came down a few pips. bar 1 made about 4 time more progress to the downsie on LESS volume. so bar 2 must have been big buyorders kicking in. profitaking is reaosnable after we see such wide spread down bars..the question si now, if buy orders continue to kick in. but i wouldnt have gone short here. if you think you need to see you should only look for shorts around the red line to have a little safety. longs preferably at the green line area or after a shakeout which kills the stops below the lows and comes back up.
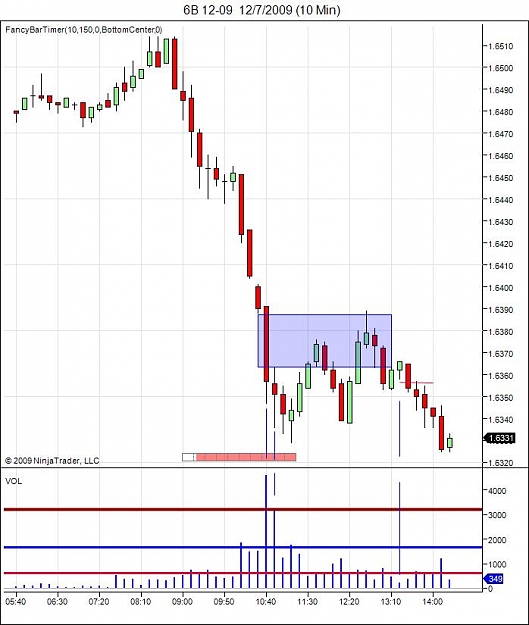
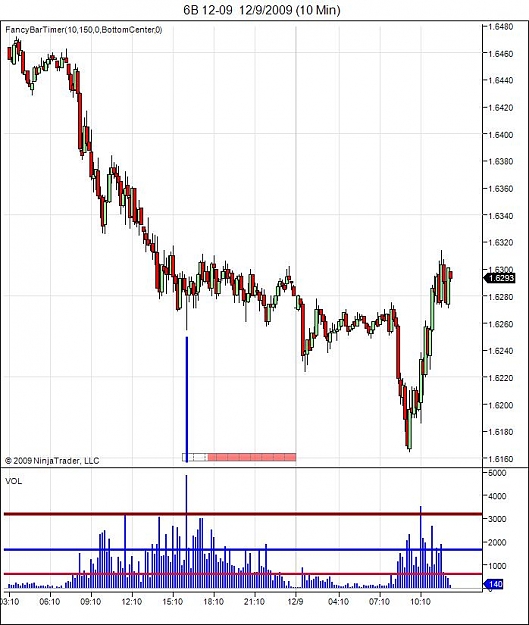
I attach here futures volumes from which i also made desicion to go short - Would You tell the same story here what about IBFX volume said ?
ps
such volume increase on this time on futures is ULTRA HIGH volume
i dont know how the trade played out since i am only referring to your screenshot. shorting here imho is a bad idea. look behind: we saw volume stepping in and the result is a slight turnaround of the price. now we try to go down but the volume compared to the vol on the previous downbars is pretty tiny. see the little trendchannel which developed here. you entered in the middle, so your risk is 50% to the upside and 50% to the downside. we want to reduce our risk...
see the things i have marked o nthe chart. 1= the wide spread downbar indicating...
Joined May 2008
|
Status: has long shorts
|2,584 Posts
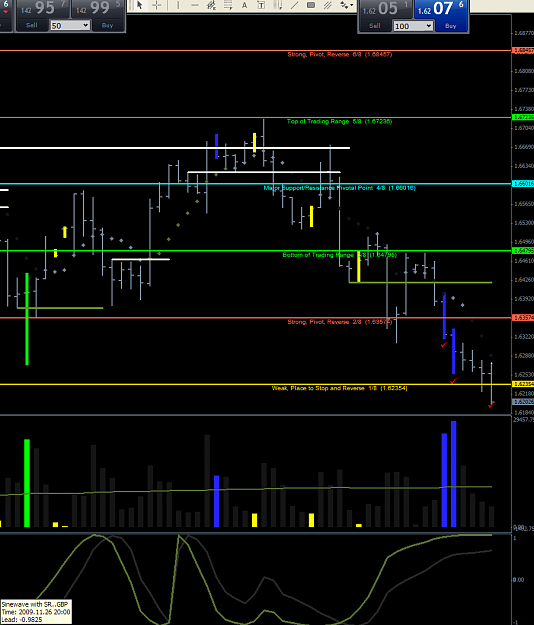
i would say the same here. the bar is a ND, but look what we have behind us...excessive volume. it is always risky to go short against this. it might work but the odds are higher that we might see a change of direction hee- even tough if it only is a little retracement.
I attach here futures volumes from which i also made desicion to go short - Would You tell the same story here what about IBFX volume said ?
ps
such volume increase on this time on futures is ULTRA HIGH volume
i would say the same here. the bar is a ND, but look what we have behind us...excessive volume. it is always risky to go short against this. it might work but the odds are higher that we might see a change of direction hee- even tough if it only is a little retracement.
Lets see if i will loose tomorow all my 120 pips ( i am not counting pips.. but just writing it here in pips )
EDIT:
I see some mistakes in my orders where i should wait or not to take.. but that is after fact for me yet..
But just attached picture how i done today..
Lets see if i will loose tomorow all my 120 pips ( i am not counting pips.. but just writing it here in pips )
EDIT:
I see some mistakes in my orders where i should wait or not to take.. but that is after fact for me yet..
But just attached picture how i done today..
Best,
Tom
Ignored
NEVER try shorting agianst stopping volume that was very clear on the bottom of the chart .
I attach here futures volumes from which i also made desicion to go short - Would You tell the same story here what about IBFX volume said ?
ps
such volume increase on this time on futures is ULTRA HIGH volume
Just want to say thanx to all the contributors of this thread, i have read through this and the "Learning to trade VSA" thread and finally have a little confidence to post a chart, im a big Malcombe fan because i like larger moves and prefer to Stalk the trade with the full story to back up my decision...
But unfortunately i cant seem to to do this consistently at all, still trying to put it all together an grasp the BACKGROUND info, also i dont see many people talking about timing..
Please let me know what you guys think of this, where would you enter if at all? and what am i NOT seeing?? all comments welcomed
Please excuse my double pic, dont know how to stop this!! :/
Chart 1
GU 4Hr London session
What i think i see
Three red checks
A) the first 2 checks =(Strength coming in on high volume Down Bars) Blue bars.
Please let me know what you guys think of this, where would you enter if at all? and what am i NOT seeing?? all comments welcomed
Ignored
Hi,
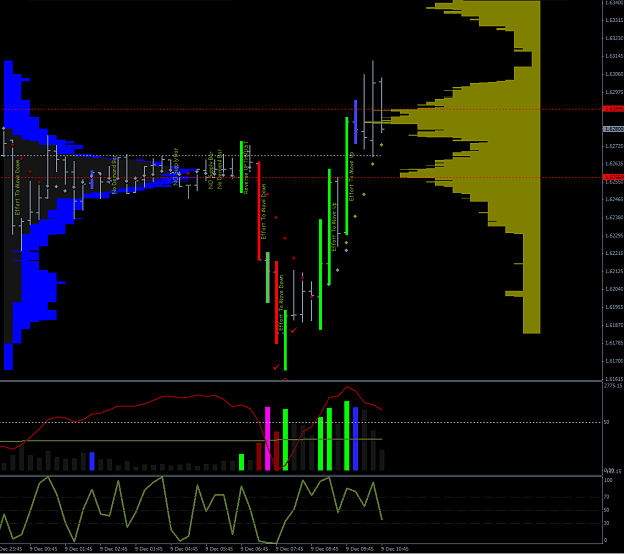
Chart 1 A) the first 2 checks =(Strength coming in on high volume Down Bars) Blue bars. - this is supply breaking through support on the left, weakness.
B) followed by no supply bars on narrow spreads
- yes, bars show smaller spread; however, three things are missing: first, no strength on the back ground; second, lack of reaction on potential buying; and third, trend is down.
C) last check = Low volume wide spread down bar, closing on the lows at MML 1/4 level and Daily Pivot S1= test of supply?? are these weak holders? -the spread is widening showing acceleration. lower volume shows that less it takes less volume to push market lower. I also think that dropping volume is because of time of day.
i am not sure what you mean by 'weak holders'.
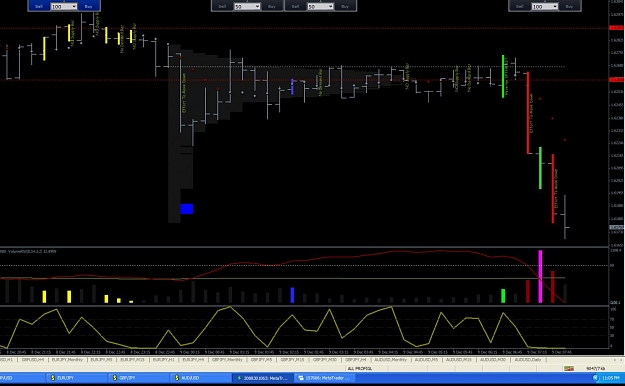
Chart #2
Several extra high volume down bars = (Strength lurking in the back?)
how would you enter this trade if at all? - market is breaking through support on good volume - weakness.
the pink volume bar potential buying but all these buyers had to liquidate on the next bar. this is supply absorbing demand.
from my point of view, on all these examples it is too late to sell and there is no buying entry .
Just want to say thanx to all the contributors of this thread, i have read through this and the "Learning to trade VSA" thread and finally have a little confidence ...
Ignored
Hello Ace
Could you please post sinewave with SR indicator, please?
Chart 1 A) the first 2 checks =(Strength coming in on high volume Down Bars) Blue bars. - this is supply breaking through support on the left, weakness.
B) followed by no supply bars on narrow spreads
- yes, bars show smaller spread; however, three things are missing: first, no strength on the back ground; second, lack of reaction on potential buying; and third, trend is down.
[b] C) last check = Low volume wide spread down bar, closing on the lows at MML 1/4 level and Daily Pivot S1= test of supply?? are these...
Ignored
Thank you sir, feels good to actually hear from someone else