Here is what distribution tends to look like if anyone is having trouble understanding my post above...this is my brokers Hang Seng tracker from a month or two ago. I saved this chart as the perfect example.
I took a few ticks out of this one, but in the end the market rallied way above this level.
Hourly chart showing about 3 days of distribution
I took a few ticks out of this one, but in the end the market rallied way above this level.
Hourly chart showing about 3 days of distribution
Attached Image (click to enlarge)
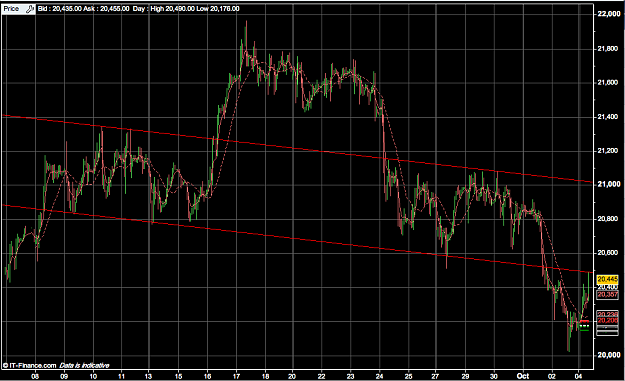
![Click to Enlarge
Name: CropperCapture[2].jpg
Size: 63 KB](/attachment/image/371353/thumbnail?d=1365594653)