Wanted to throw up an equities chart for a change. A classic pin bar at swing high, retesting the highs around 17.0 from august. Price stalled, and moved up through the resistance, but there was not enough buying momentum to keep it there. Will we see a bounce around 16.00-16.20?
Just a nice reminder that price patterns work in all markets.
Joined Feb 2008
|
Status: sucker for punishment
|2,444 Posts
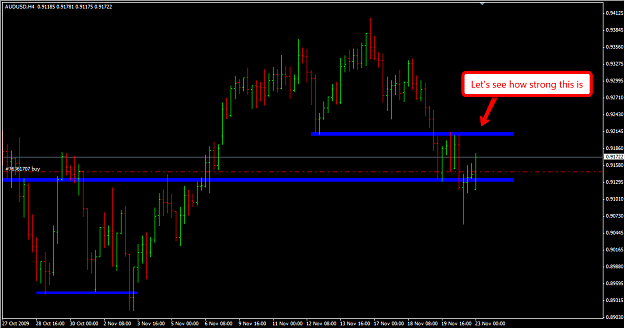
gb/us I3B on the 4h chart looks like its about to break to the down side?? maybe a chance to get in on the down swing, or extend your short if your already in?? its lying on a PPZ so iv set my order to trigger just under that
jon
EDIT: added chart,excuse the mess its my working chart,( im off to bed..lol)
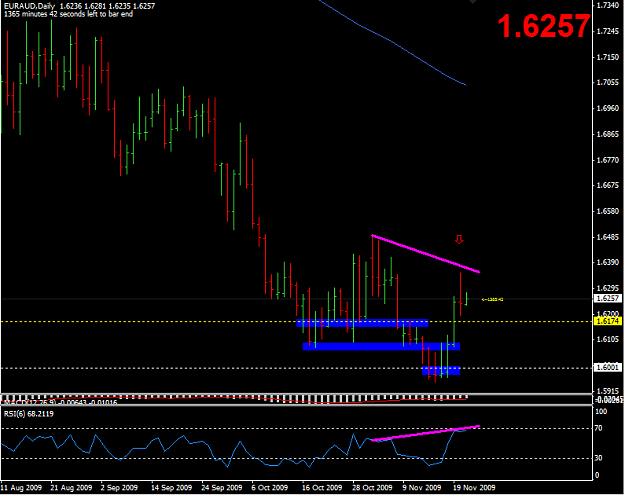
Pins on AUD/CHF and AUD/EUR (or EUR/AUD if you prefer ) which have noses on the 61.8 Fib.
Anyone thinking of trading these?
Ignored
I was looking at both of these and I like that they are with the trend and have hidden divergence, and also are off of the daily floor trader pivot (for those who use them).
My main concern is that there isn't much space for them to run at all. With Eur/Aud, I feel like the trend is strong and it has a good chance of making it down to 1.61 and 1.60 if it can get through the traffic around 1.6170.
|
Joined Jul 2007
|
Status: Or Die Tryin'
|250 Posts
Would have liked to see some divergence but liked the location, forming a double bottom and the pin just looked good to me. Hoping price makes it back to the Weekly Pivot
Attached Image
"Whether you think you can or can't, you're right." Henry Ford
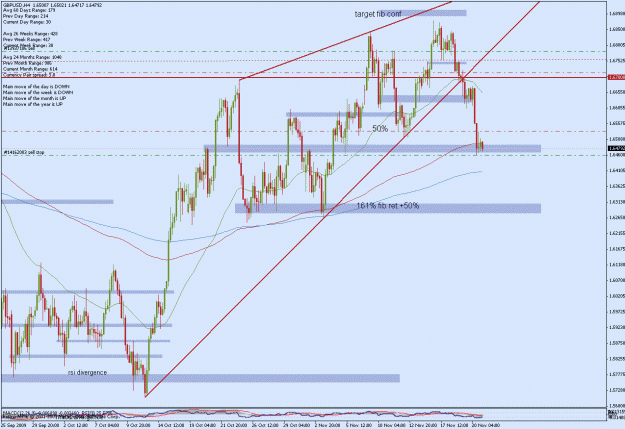
Its an uptrend firstly, then there is the confluence of the uptrend line and the MA and some prior support around this level 1.68 level which is a round number. Add to that its a 50% fib (although I am not quite sure what its based off).
Against it I would say the fact that its been a pretty sideways market since 27th Oct and the one breakout didn't really take hold in that price has retraced back into the range.
Views?
Ignored
Hey Verno! I pull fibs off of monthly weekly and daily TF's. One of those is where you viewed the 50% fib. I was looking for price to bounce off that 150ema and close ad a green pin or even a BUOB type pin there at the swing low. All of your views on the 150ema/round number and trend trading are spot on. I look for trades that I can take with multiple factors (or "confluence" as the smart guys on J16 refer to it) telling me to buy or sell. Great job!
might be worth looking at the Daily..........before you make a decision
Ignored
Very good point Danku. I was looking for PA to develop on that 4hr chart for a high probability long. It just didn't happen. I agree with you though that it's a good idea to look at higher tf's for bias.
As I said in the previous post, higher timeframe signals are generally more reliable than lower timeframe signals....
Ignored
Personaly, I am more bullish on this pair than bearish for now...
As we all know, the more times price touches a trendline, the stronger it is. The daily pin bar is sitting right on this very strong trendline.
Also, I like to see the close of an outside bar closer to it's low (in this case).
If I play the daily pb long, I'll definitely play it tightly.
Joined Jan 2008
|
Status: In Fibonacci We Trust
|2,397 Posts
I just sat down a few minutes ago to get caught up on the posts here on the thread. I am really excited by what I see posted over the past weekend. So many posts with so many charts. Thumbs up to all who have posted charts. It looks like we could have a really good couple of days trading this week before the holiday. Newer traders please remember, that before you pull the trigger-confluence, bar confirmation and a plan for TP. Best of luck trading everyone!
I just had to post this because (a) I was proud of it and (b) I wanted to say thank you to all the people from James16 onwards who have resolutely made this thread educational, enlightening and friendly.
I wanted to trade this pin: Attachment ...
A BEOB on the 15 minute chart at a swing high off previous resistance (marked grey area)....
Ignored
very nice trade Sir...
but a small reminder (mainly for the others), this is not a technically correct BEOB: this is what i call a ''quasi-BEOB" or "pseudo-BEOB". i trade them from time to time.
if u look closely at those 2 bars, the 2nd bar (of your BEOB) does not engulf the 1st bar. a BEOB must completely engulf the 1st bar & close at/near the lows.
when we post, we must always keep in mind the learning curve of the others
Personaly, I am more bullish on this pair than bearish for now...
As we all know, the more times price touches a trendline, the stronger it is. The daily pin bar is sitting right on this very strong trendline.
Also, I like to see the close of an outside bar closer to it's low (in this case).
If I play the daily pb long, I'll definitely play it tightly.
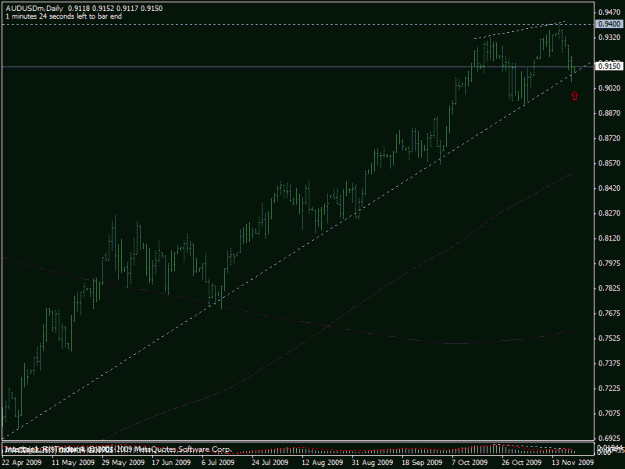
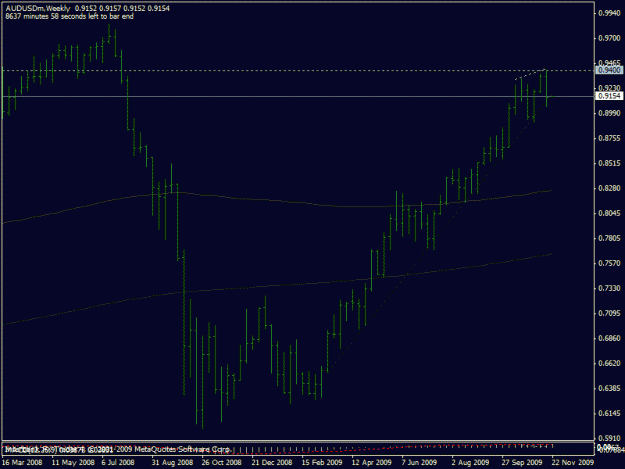
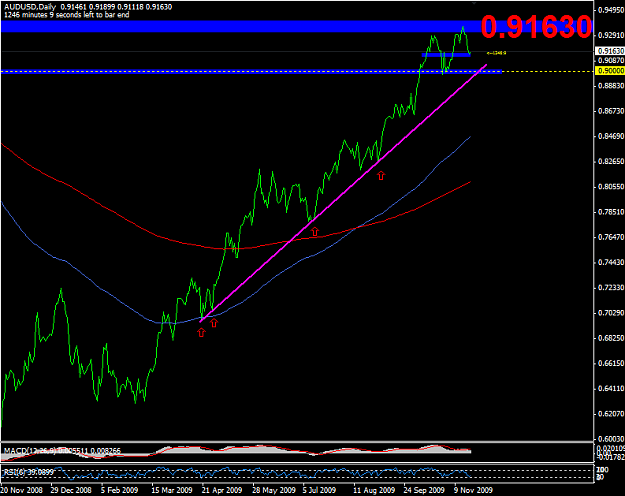
I try not to have a bias but I wouldn't play either of these setups personally. Price is well above the 61.8 fib from the last big weekly swing and there are no other real confluences supporting a short. If we break long and get through the traffic I think we will be seeing a test of .9400 since the trend is so strong.
Personally, I am more bullish on this pair than bearish for now... As we all know, the more times price touches a trendline, the stronger it is. The daily pin bar is sitting right on this very strong trendline.
....
Ignored
imho, generally the more times price touches a trendline, the weaker the trendline becomes, & the more prone it is from breaking.
a trendline or "horizontal trendline" (horizontal S & R) with lesser touches, is stronger than a trendline with more touches.
u can think of it as a hammer pounding on glass. the more times the hammer pounds on the glass, the more prone it is for the glass to break.
EDIT: imo, the first sentence above is similar to a 'paradox' regarding volume, where it says "there is weakness in an upmove/uptrend, or there is strength in a downmove/downtrend."
imho, generally the more times price touches a trendline, the weaker the trendline becomes, & the more prone it is from breaking.
a trendline or "horizontal trendline" (horizontal S & R) with lesser touches, is stronger than a trendline with more touches.
u can think of it as a hammer pounding on glass. the more times the hammer pounds on the glass, the more prone it is for the glass to break.
Ignored
I don't really use trendlines that much but SC you are right on this one. I've also heard that the steeper trendlines are more prone to failing then those with a gentle slope up. The more time price tests an area, the more likely it won't hold anymore.
SC you are like the j16 and trading encyclopedia lol
Scott
edit: I believe it takes 2 points to draw a trendline, and the 3rd touch confirms if the trendline is valid or not. Also I believe it is best to make sure price never closes below an uptrend line. It would probably help to draw it on a line chart like this. The first 2 arrows I would count as 1 touch, and the 2nd we can then draw a TL. The 3rd touch for me confirms the TL.
If someone who uses trendlines a lot could chime in that would be helpful.
I don't really use trendlines that much...I've also heard that the steeper trendlines are more prone to failing then those with a gentle slope up. The more time price tests an area, the more likely it won't hold anymore.
....
Ignored
i agree
probably because steep trendlines = steep trends = too high/low too fast = unsustainable gentle-sloped trendlines = more sustainable
Quote
Disliked
...SC you are like the j16 and trading encyclopedia lol..
Thanks Sir... but i dont believe so..
i have amnesia & seriously malnourished now, seriously....
i think using a line chart has a lot of merit. some great traders here use it.
probably the Big Guys/commercial traders do too. lol