A picture should paint a thousand words. So heres two thousand.
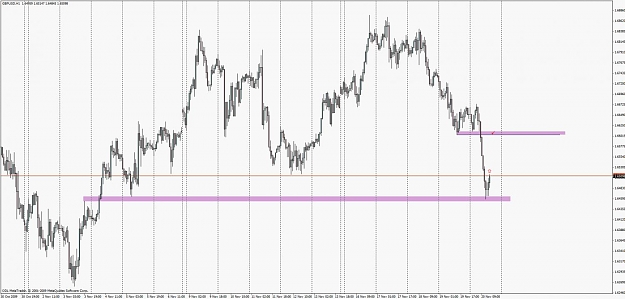
Using multiple time frames gives a lot more clarity. I've drawn circles around the the points that look like false breaks. I've boxed the candle that looks like the origin of the breakout.
(Note the double top, pull back and down trendline)
I'll be watching the 143.20 level if price reaches there. We may also have an upward tl to confirm support.
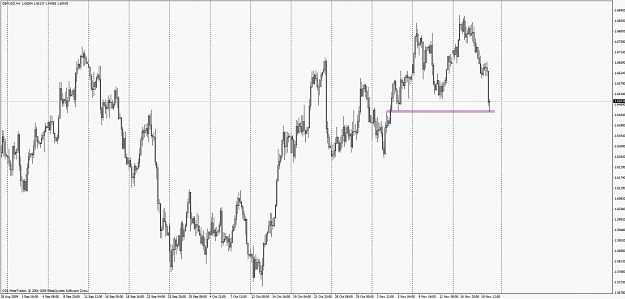
Attached Image (click to enlarge)