• Home
  • Forums
  • Trades
  • News
  • Calendar
  • Market
  • Brokers
  • Login
  • Join
  • User/Email: Password:
  • 4:32am
Menu
  • Forums
  • Trades
  • News
  • Calendar
  • Market
  • Brokers
  • Login
  • Join
  • 4:32am
Sister Sites
  • Metals Mine
  • Energy EXCH
  • Crypto Craft

Options

Bookmark Thread

First Page First Unread Last Page Last Post

Print Thread

Similar Threads

Time action momentum trading 90%+ accuracy 0 replies

Acceptable Accuracy Ratio for Profitable trading 29 replies

Trading with Coinflip Accuracy!! 29 replies

historical data accuracy puzzlement. 1 reply

accuracy problems or stable market 0 replies

  • Commercial Content
  • /
  • Reply to Thread
  • Subscribe
  • 1,373
Attachments: Trading with Deadly Accuracy
Exit Attachments
Tags: Trading with Deadly Accuracy
Cancel

Trading with Deadly Accuracy

  • Last Post
  •  
  • 1 2Page 3456 139
  • 1 Page 3 139
  •  
  • Post #41
  • Quote
  • Nov 16, 2009 10:09pm Nov 16, 2009 10:09pm
  •  The Lord
  • | Joined Oct 2009 | Status: Member | 296 Posts
Quoting shahab8b
Disliked
I say, the Trend Following setup that you mentioned is classic and practical, but you refere mostly to AUDUSD and Gold, which have been acted like a textbook since March, but you cant see the same nice pattern in EURUSD , I'd say its tradable with this setup but you need to treat it differently than commodity currencies,
Ignored
S/R levels work on any pairs. But not with aggressive entries at least. I recommend traders to put their entries only with proper price action at those S/R. Combined with PA, this system is deadly. No doubt!
1
1
  • Post #42
  • Quote
  • Nov 16, 2009 10:10pm Nov 16, 2009 10:10pm
  •  Iamfx
  • Joined Apr 2009 | Status: Member | 518 Posts
Quoting The Lord
Disliked
I will try to answer if I am right.

First of all, you are trying to catch a sharp falling knife. As wmd stated, that is an aggressive entry. That was still not a problem. I feel your stop was very small. It should have been below the 1.48202 level.

Next thing I can see is, you haven't drawn your S/R line at the exact tip of bars. If you had entered at the same level later on when price started to come up, there wouldn't have been a problem at all!

Sorry if I am wrong. I am just practicing the wmd method.
Ignored
Thanks for your answer. I thought SL's were at 10x spread so 20-30 pips?
Cheers
We are all One. Be present. Be the Observer
1
 
  • Post #43
  • Quote
  • Nov 17, 2009 12:37am Nov 17, 2009 12:37am
  •  piphopper
  • | Joined Nov 2009 | Status: Junior Member | 1 Post
I am new to this so excuse my ignorance. But does this apply to all currency pairs?
1
 
  • Post #44
  • Quote
  • Nov 17, 2009 1:11am Nov 17, 2009 1:11am
  •  The Lord
  • | Joined Oct 2009 | Status: Member | 296 Posts
Quoting Iamfx
Disliked
Thanks for your answer. I thought SL's were at 10x spread so 20-30 pips?
Cheers
Ignored
I am also confused with 10x spread SL. May be the author of the thread can clarify a bit.
1
 
  • Post #45
  • Quote
  • Nov 17, 2009 3:50am Nov 17, 2009 3:50am
  •  summerplace
  • | Joined Aug 2008 | Status: Member | 30 Posts
Quoting wmd
Disliked


Once we are familiar with identifying s/r/bo levels, we can advance to the equally deadly strategy for trading diagonal price movement. That should get the day traders excited.
Ignored
wmd:

Here's to giving you your wings - I look forward to your strategy for
trading diagonal price movement.


thanks
1
 
  • Post #46
  • Quote
  • Nov 17, 2009 4:33am Nov 17, 2009 4:33am
  •  wmd
  • | Commercial Member | Joined Apr 2009 | 418 Posts
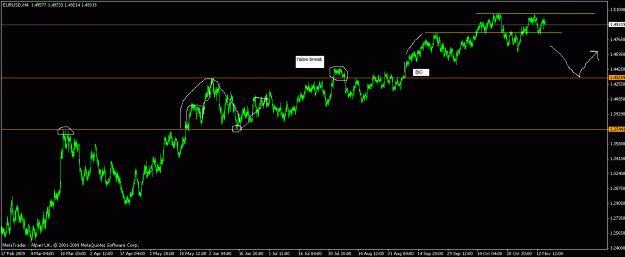
This is what i see on eu.
Attached Image (click to enlarge)
Click to Enlarge

Name: eu1.gif
Size: 17 KB
 
 
  • Post #47
  • Quote
  • Nov 17, 2009 5:34am Nov 17, 2009 5:34am
  •  wmd
  • | Commercial Member | Joined Apr 2009 | 418 Posts
Using this technique we are identifying precise entry points for our trades. Any significant breach of those levels would in effect nullify the validity of the trades.

I used to use a hard stop of 40 pips. However, different instruments exhibit varying degrees of volatility. I have taken the spread as an arbitary measure of that. So 10 times spread is typically more then enough.

EU - 20-25 pips
GU - 30-40 pips
EY - 35-50 pips
GY - 60-80 pips
UC - 40-50 pips
 
 
  • Post #48
  • Quote
  • Nov 17, 2009 6:51am Nov 17, 2009 6:51am
  •  challenger78
  • | Joined Sep 2007 | Status: Member | 297 Posts
I like your clear charts and explanation.

How far back do you usually look for support/resistance?

Also, do you take into account news announcements and macroeconomic factors at all? Or is it purely chart based technique as we've seen so far?

Thanks for starting the thread.
1
 
  • Post #49
  • Quote
  • Nov 17, 2009 7:16am Nov 17, 2009 7:16am
  •  wmd
  • | Commercial Member | Joined Apr 2009 | 418 Posts
I zoom out as far as i can to find the price turning points. A 4hr chart displays atleast 4 to 5 months of data which is more then enough.

This method is a technical play based on breakouts where we have untested resistance/support. News tends not to effect the outcome.
 
 
  • Post #50
  • Quote
  • Nov 17, 2009 8:05am Nov 17, 2009 8:05am
  •  samer960
  • Joined Dec 2008 | Status: Member | 673 Posts
Hi
thank you for this intresting method
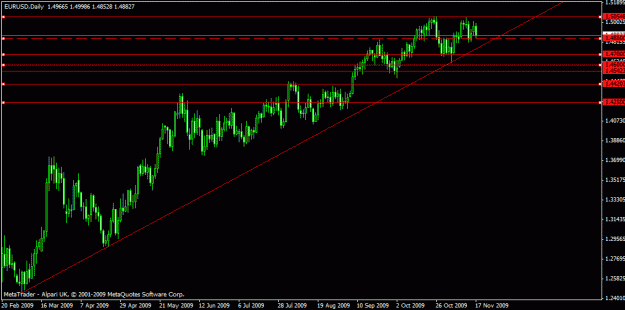
i just would like to mention that many important levels for EU are not present in your chart .
pls let me know if i am missing something .
thanks

Quoting wmd
Disliked
This is what i see on eu.
Ignored
Attached Image (click to enlarge)
Click to Enlarge

Name: eu.gif
Size: 16 KB
 
 
  • Post #51
  • Quote
  • Nov 17, 2009 8:19am Nov 17, 2009 8:19am
  •  wmd
  • | Commercial Member | Joined Apr 2009 | 418 Posts
Samer,

For the purpose of this method, i am specifically looking for 'untested' levels ie a resitance which had been breached but was not tested as support; or a support which was breached but not tested as resistance.

I removed other s/r levels for sake of clarity on the charts.

All s/r levels are significant. If it helps, in future i will try to show more levels and colour code the ones i am looking to trade.
 
 
  • Post #52
  • Quote
  • Nov 17, 2009 8:45am Nov 17, 2009 8:45am
  •  samer960
  • Joined Dec 2008 | Status: Member | 673 Posts
wmd

i got it
thanks for ur reply

Quoting wmd
Disliked
Samer,

For the purpose of this method, i am specifically looking for 'untested' levels ie a resitance which had been breached but was not tested as support; or a support which was breached but not tested as resistance.

I removed other s/r levels for sake of clarity on the charts.

All s/r levels are significant. If it helps, in future i will try to show more levels and colour code the ones i am looking to trade.
Ignored
1
 
  • Post #53
  • Quote
  • Nov 17, 2009 8:55am Nov 17, 2009 8:55am
  •  redart007
  • | Joined Oct 2007 | Status: Member | 296 Posts
Thanks for posting those links...

Quoting Fudomyo
Disliked
on your chart, this area doesn't suggest going long because the retest of support became resistance. (black circle) Your entry would be short after resistance holds.

imho, it's better to learn drawing your own SR lines. zoom your chart out and observe the candle open, high, low, and closes. the price points which have the highest frequency of OHLC touching them are support or resistance areas. It's best to start on the daily chart scrolling down to 1H, this will show you the highest probability areas. (that's how I drew these) It's very fast...
Ignored
1
 
  • Post #54
  • Quote
  • Nov 17, 2009 9:20am Nov 17, 2009 9:20am
  •  finswin56
  • | Joined May 2008 | Status: Member | 308 Posts
Quoting wmd
Disliked
This is what i see on eu.
Ignored
Excellent thread WMD. This is very similar to the No Brainer thread, which makes it a very good thing IMO.

Regarding this EUR chart, why don't you have the top of that false break marked off as resistance?
 
 
  • Post #55
  • Quote
  • Nov 17, 2009 9:36am Nov 17, 2009 9:36am
  •  wmd
  • | Commercial Member | Joined Apr 2009 | 418 Posts
The level shown (14330) acted as the orignal resistance. The long pull back from that price demonstrates its significance. The false breakout is recognised by the inability of the price to move higher from that level. It falls back under, taps the level a few times and eventually breaks through.

The ceiling of the false breakout also has significance and is tradeable, but just not for this particular type of setup.
 
 
  • Post #56
  • Quote
  • Nov 17, 2009 9:54am Nov 17, 2009 9:54am
  •  redart007
  • | Joined Oct 2007 | Status: Member | 296 Posts
I was watching cable today at this level....

If you look at the 5min chart you can see it does a small song and dance before heading north, which gives us a nice reversal area when it comes back...cool

Quoting wmd
Disliked
gbp/usd live.
Ignored
Attached Image (click to enlarge)
Click to Enlarge

Name: gu.jpg
Size: 76 KB
 
 
  • Post #57
  • Quote
  • Nov 17, 2009 9:58am Nov 17, 2009 9:58am
  •  redart007
  • | Joined Oct 2007 | Status: Member | 296 Posts
and this was the 15min as shown by WMD yesterday...

Quoting redart007
Disliked
I was watching cable today at this level....

If you look at the 5min chart you can see it does a small song and dance before heading north, which gives us a nice reversal area when it comes back...cool
Ignored
Attached Image (click to enlarge)
Click to Enlarge

Name: gu2.jpg
Size: 76 KB
 
 
  • Post #58
  • Quote
  • Nov 17, 2009 10:04am Nov 17, 2009 10:04am
  •  pa18
  • | Joined Jan 2009 | Status: Member | 467 Posts
Nice thread, keep it going, I'm alway want to learn
1
 
  • Post #59
  • Quote
  • Nov 17, 2009 10:05am Nov 17, 2009 10:05am
  •  wmd
  • | Commercial Member | Joined Apr 2009 | 418 Posts
Quoting wmd
Disliked
gbp/usd live.
Ignored

Missed precise entry by 3 pips so we were not too far out of the zone, bounced 70.

The double top does look menacing though.
Attached Image(s) (click to enlarge)
Click to Enlarge

Name: srlev3.gif
Size: 17 KB
Click to Enlarge

Name: guupdate.gif
Size: 14 KB
 
 
  • Post #60
  • Quote
  • Nov 17, 2009 10:17am Nov 17, 2009 10:17am
  •  The Lord
  • | Joined Oct 2009 | Status: Member | 296 Posts
Quoting wmd
Disliked
Missed precise entry by 3 pips so we were not too far out of the zone, bounced 70.

The double top does look menacing though.
Ignored

Great!
1
 
  • Commercial Content
  • /
  • Trading with Deadly Accuracy
  • Reply to Thread
    • 1 2Page 3456 139
    • 1 Page 3 139
0 traders viewing now
  • More
Top of Page
  • Facebook
  • Twitter
About FF
  • Mission
  • Products
  • User Guide
  • Media Kit
  • Blog
  • Contact
FF Products
  • Forums
  • Trades
  • Calendar
  • News
  • Market
  • Brokers
  • Trade Explorer
FF Website
  • Homepage
  • Search
  • Members
  • Report a Bug
Follow FF
  • Facebook
  • Twitter

FF Sister Sites:

  • Metals Mine
  • Energy EXCH
  • Crypto Craft

Forex Factory® is a brand of Fair Economy, Inc.

Terms of Service / ©2023