Hello!
Reread your writings and I still have a few questions! Maybe someone can explain to me!?
A few days ago I started to test this indicator.
Questions as follows:
1. How best to work on the TF M5 or greater - for example H1 (I understand that people here are traded on both the M5 and the H1, H4)
2. If traded to the M5 a SL and TP to better use?
3. If trade is to be an H1 what SL and TP better to use?
I worked on "Alpari micro" Lot 0.01
In the past, thanks for the replies!
And yet the question - with which pairs better to work?
Sorry for my writing mistakes - English is not my native language.
for those interested by my new indic ; I writed it yesterday =
crossing T/K on 4 consecutive TF ; i think it's useful & visual
(actual TF is below = the 4th line)
kinonen
Ignored
Hi Kinonen,
Thanks for your hardwork. I have just downloaded and put the indic. on EUR/AUD 1hr chart. If you are online now, you can see what I am talking about. Based on the indicator, it displays Ts/Ks on 1hr/D/W charts. But if you look at the 4hr chart, Ts/Ks is crossed on 4hr as well.
Now, if you put the indic. on 4hr, you would see all the higher TF Ts/Ks crossed.
Could you explain why the discrepancy exists?
Thanks,
ApuFx
Ignored
the actual TF is represented by the lowest line
so , when you put indic on 1H you have 1H - 4H - DAYLY - WEEKLY
but if you put on Dayly for example you obtain
Daily weekly monthly monthly
and on weely == > W1 MN MN MN !
so you can use it from 1min until 4H
the actual TF is represented by the lowest line
so , when you put indic on 1H you have 1H - 4H - DAYLY - WEEKLY
but if you put on Dayly for example you obtain
Daily weekly monthly monthly
and on weely == > W1 MN MN MN !
so you can use it from 1min until 4H
kino
Ignored
Cool. So it works the same as the Heiken Ashi Trading system Indicator designed to work with the HA Candles. Yes? Except that your using the Ichi Ts and KS cross data for input instead of the HA candle data for input. Correct?
fxScavenger
Arrogance is just Ignorance misspelled.
abso-PIPn-lutely
im do so many thing about trading ,indicator until naked trade. Till the end , im decide stick with ichimoku!
IT's clear entry , when to stay out . MORELY im suprise my ability to forecast the price but still the fundamental is my weakness.
Thank you for your excellent work. I have a request, I think this would be really useful for all, and should not take you too long hopefully.
Can we mod the indicator to display simply the following:
1. TF. (So a mtf one where we can specify the tf to show the following items.
2. Price vs tenkan: red for below, blue for above
3. Price vs Kijun: red for below, blue for above
4. Price vs cloud: red for below, blue for above
5. ts/kijun cross: red for ts below kijun, blue for ts above kijun.
Because the ts/ks cross can be lagging, price is a better indication.
If you put say on a m5 chart the bars as above for m1, m15 and m60, you will have a much clearer idea of the totality of ichi, enabling much better decisions on your current chart, especially useful for scalping even on the m1.
For this reason, I hope you will consider this request.
for those interested by my new indic ; I writed it yesterday =
crossing T/K on 4 consecutive TF ; i think it's useful & visual
(actual TF is below = the 4th line)
kinonen
Nice trades, where these just based on 1h Kumo breakouts?
If so what rules do you apply to this, Ie Ts clearing price?
Also I have noticed you don't seem to use the Ts red line?
Ignored
as my study on this forum , the best entry are w/d/4h/1h allign together with ichimoku.
VIC? am i right???
im just can tell what currency that move on the way up on the ichimoku approach at present price data.But for sure , im looking the same way to approach the next week market with the same action.ICHIMOKU!
Thank you for your excellent work. I have a request, I think this would be really useful for all, and should not take you too long hopefully.
Can we mod the indicator to display simply the following:
1. TF. (So a mtf one where we can specify the tf to show the following items. 2. Price vs tenkan: red for below, blue for above 3. Price vs Kijun: red for below, blue for above 4. Price vs cloud: red for below, blue for above
[color=seagreen]5. ts/kijun cross: red for ts...
Ignored
I have a problem with Price vs Kumo position , but i am working on it
(because of parameters 9 26 52 i am a little confused and have to think about)
kino
I have a problem with Price vs Kumo position , but i am working on it
(because of parameters 9 26 52 i am a little confused and have to think about)
kino
Ignored
now it 's finished red = close is below blue = close is above yellow = close in the kumo
Cool. So it works the same as the Heiken Ashi Trading system Indicator designed to work with the HA Candles. Yes? Except that your using the Ichi Ts and KS cross data for input instead of the HA candle data for input. Correct?
Ignored
you're right my friend
it's the indicator i have modified for other threads and i've thought i can do the same thing for this one (fxprime ,FX50 , fx scalping and on others)
you can see another modification just below that would be interesting too
now it 's finished red = close is below blue = close is above yellow = close in the kumo
kinonen
Ignored
Hi Kinonen,
Thanks man for your hardwork. I have been thinking about the same concept once you put out the other version.
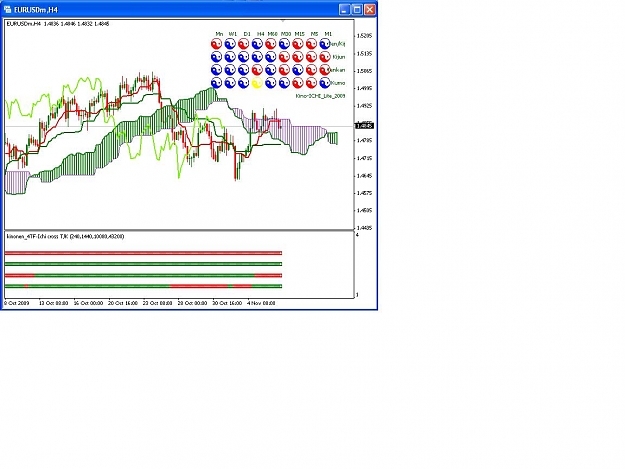
I hope you woudn't find by asking you a couple of questions. But I am not sure how to interpret the signals. Let's say my attached EUR/USD 4hr.
Based on your indicator, it seems to me ( I could be wrong)
1. Ts/KS cross is above Kumo but it is below.
2. Ks is above Kumo but it is below.
3. Ts is below Kumo but it is inside.
4. Not sure how to interpret the Kumo.
now it 's finished red = close is below blue = close is above yellow = close in the kumo
kinonen
Ignored
Hi Kinonen,
Thanks man for your hardwork. I have been thinking about the same concept once you put out the other version.
I hope you woudn't find by asking you a couple of questions. But I am not sure how to interpret the signals. Let's say my attached EUR/USD 4hr.
Based on your indicator, it seems to me ( I could be wrong)
1. Ts/KS cross is above Kumo but it is below.
2. Ks is above Kumo but it is below.
3. Ts is below Kumo but it is inside.
4. Not sure how to interpret the Kumo.
May be I am missing the interpreation.
Your explanation...
Ignored
The way it works is by recording where PRICE is in relation to ichi components. So if price is above Tenkan, it is shown as blue. On the 5 min GU chart as of now on my broker, eg , it shows correctly that price is below Ts (red), price is above Ks (blue). So the Ts can act as resistance and Ks can act as support. It also shows Kumo as blue, which means that price is above the cloud.
It shows that ts/ks have crossed because it is blue, it means that the cross is long. It does not say however whether the cross happened below, in or above the cloud. On the m5 chart on its own, you would wait for price to cross above the ts before taking a long. You should also consider the other tf's.
It shows that all components on the m15 and m30 charts are long and that except for the downward cross of t/k on the m60, all components are long.
So it gives you valuable information at a glance.
Hope this helps.
Regards
Pardy
The way it works is by recording where PRICE is in relation to ichi components. So if price is above Tenkan, it is shown as blue. On the 5 min GU chart as of now on my broker, eg , it shows correctly that price is below Ts (red), price is above Ks (blue). So the Ts can act as resistance and Ks can act as support. It also shows Kumo as blue, which means that price is above the cloud.
It shows that ts/ks have crossed because it is blue, it means that the cross is long. It does not say however whether the cross happened below, in or above the cloud....
Ignored
Hi Pardy and Kinonen,
Thanks for the hardwork. Thanks for clarification as well. Now, I understand about the significance of the signals. I have been thinking the signals are based on the Kumo location, but are based on the current price.
These signals are indeed very helpful. We can see all TFs at a glance. I can't say how much I as well as others, (I assume all the Ichi followers) are grateful for this indicator.
So, right now, we have all the tools at our disposal to make a great trade.
Let's hope all the Ichi followers would keep making pips.