Dear traders, I have revised this first post for clarity purpose. Below is my approach to entries and exits.
Rock System
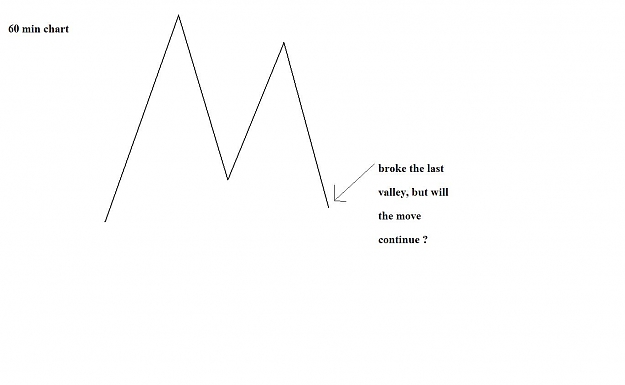
1. On a 60 min chart, look for major peaks or valleys. You can use average prices, closed prices or a 1 period SMA. It is just a gauge to define the boundaries. Wait for prices to start testing these price levels.
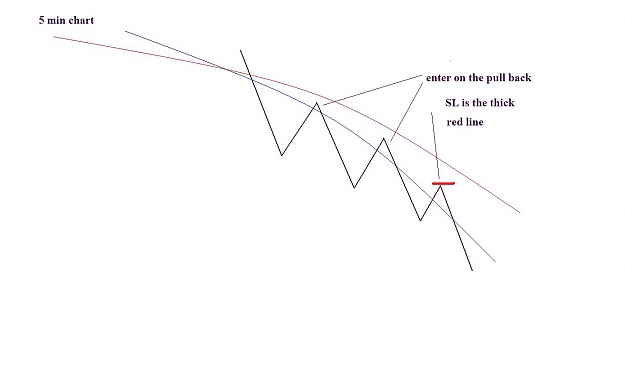
2. After that, pull out a 5 min chart, first you would one to see at least 1 candle closed outside the peak or valley. Then plot a couple of moving averages. (I use a 9 and 20 EMA). Start looking for entries when price pulls back to the MAs.
3. Basically what I do here is to look for a breakout on the 60 min chart, and I test the potential of the breakout by placing small bets every time prices pull backs to the MAs.
4. For exits, a trailing stoploss may work, however I do not use them. I prefer to use some discretion, most of the time I look for the next swing high or low as targets.
Attachment
Rock System
1. On a 60 min chart, look for major peaks or valleys. You can use average prices, closed prices or a 1 period SMA. It is just a gauge to define the boundaries. Wait for prices to start testing these price levels.
2. After that, pull out a 5 min chart, first you would one to see at least 1 candle closed outside the peak or valley. Then plot a couple of moving averages. (I use a 9 and 20 EMA). Start looking for entries when price pulls back to the MAs.
3. Basically what I do here is to look for a breakout on the 60 min chart, and I test the potential of the breakout by placing small bets every time prices pull backs to the MAs.
4. For exits, a trailing stoploss may work, however I do not use them. I prefer to use some discretion, most of the time I look for the next swing high or low as targets.
Attached Image (click to enlarge)
Attachment
Attached Image (click to enlarge)