DislikedI am looking from Price action status..ignore macd now. I am just wondering what the current candles and moving averages are telling us. Because i really dont know how to read the market in a correct way just by looking at candles. I know all the candles formation (hammers, shooting start, inverted hamers, evening stars,...) but i dont know how to see which one is the most relevant.
Is the bounce from the 21 in this case the relevant one...or are the strong bearish candles a reason to stay away. Hope someone can helpIgnored
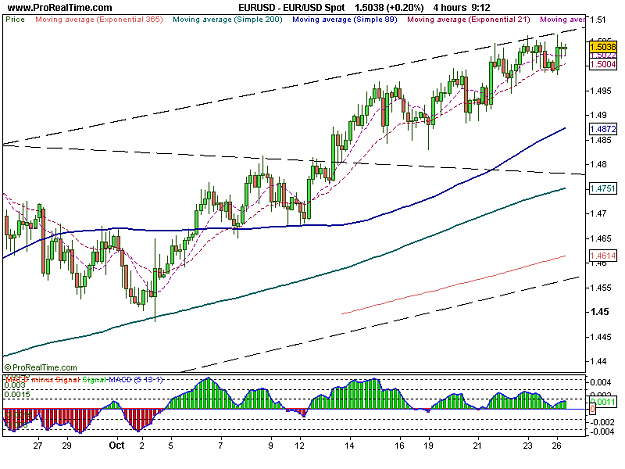
the market is in a uptrend,but it become a slow uptrend,so the market will change recent,so we can take a CT carefully!!!
the first hammer cnadle tell us the market will go down,the second bearish candle tell us again!!!!the last candle was going up and off the 21,you maybe think the uptrend is continue,but at the same time the market give us an oppotunity,we can use a small SL,to sell the eurusd!!!the R:R is excellent!!!!so we can do this CT trade,with a small SL!!!!
ANY COMMENTS WAS WELCOME!!!
and now i always tell myself,do not do the CT!!!!
AT THE SAME TIME,THE GBPUSD GO DOWN 300PIPS,maybe the gbpusd can tell us to sell the eurusd????
Attached Image