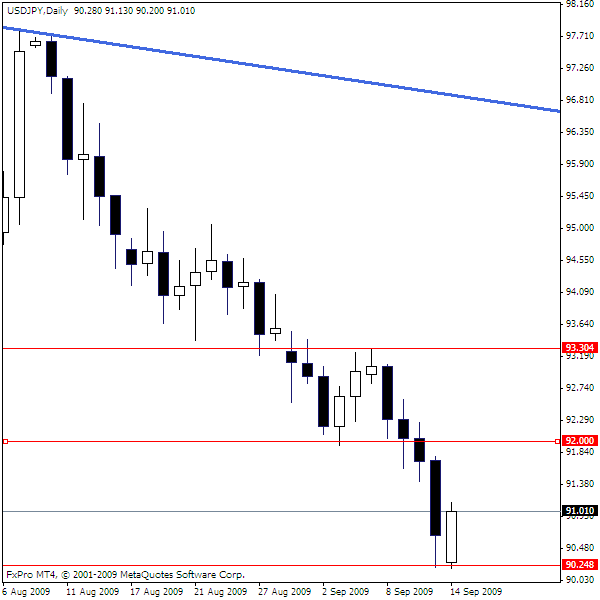
I'm with Joel. ...Waiting it out. Too many issues for this pair to deal with for the minute. ( and the retarded bit. ...it's bed time. lol)
If you want my thoughts on how much room? ...Enough room to get into profit and start moving stops. Where the stop is likely to be nicely protected. ...That's just me though.
Ignored
Ok Thanks but that may be 30 pips to some and 50 pips to some and then again it depends on the pairs volatility thanks
Thank you. Super! Location Location Location again .... I always see people trading daily more leniently but I guess it is just WAITING for the best setups and locations
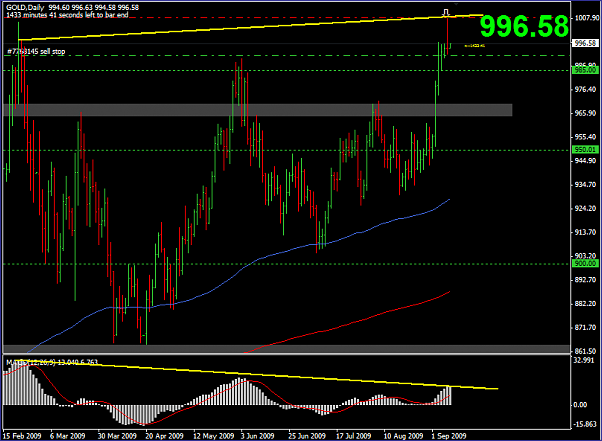
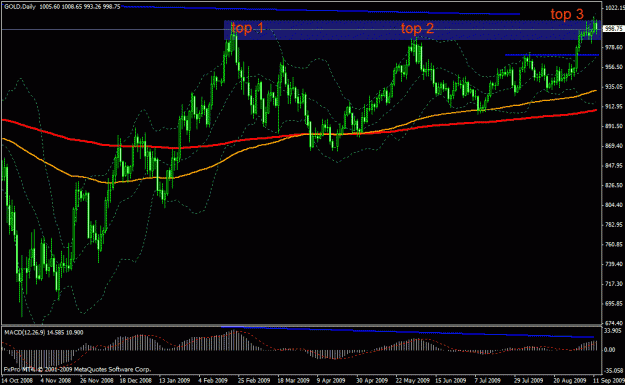
i took full bar loss(demo). i saw it as a triple top with div, some nice space before the first TP which is around 970 like yours.
i managed it on the daily chart, there was no opportunity to move stop to BE. however after the bullish pin, i set TP to BE thinking it had a higher odds to hit TP before hitting full bar stop. but it didn't happen.
so, from mike and scott's post, it seems top2 should be a trouble area instead, which was not how i saw.
Ignored
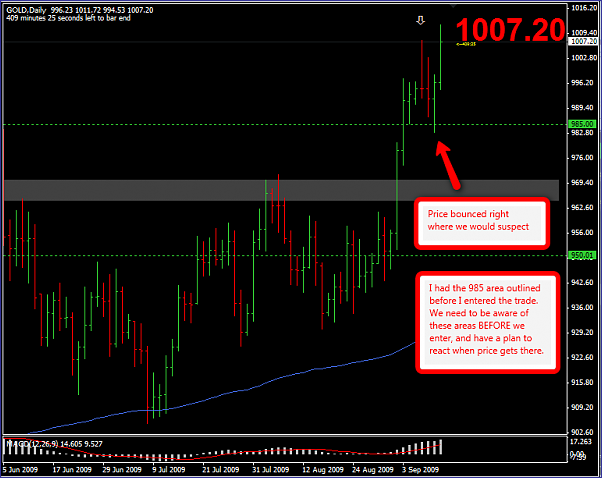
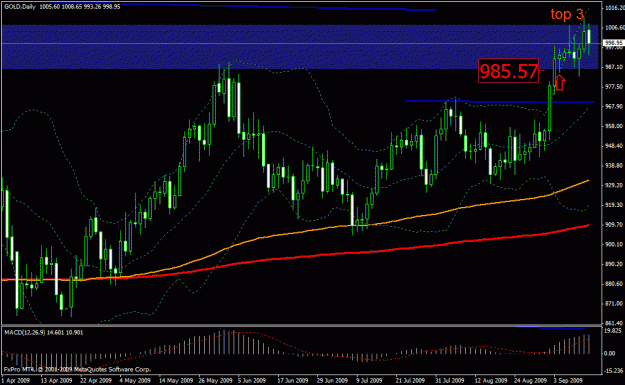
I made a post a while back about this one and how I managed it. I had outlined the 985 zone to move my stops to break even, and I believe mike took full profit around this area.
It is fine to set your first tp to 970 like you did, my first TP was around this zone also (see grey box on my chart). However, if we set TP areas beyond the first trouble spot, we need to have a plan in place to protect ourselves when price gets to that first trouble spot.
The 985 zone was the first trouble area that I identified, so I moved my stop to BE there and waited for my first TP at 970 to be hit. Some traders like mike prefer to take full profit there, and others (including myself) prefer to move their stops up and see if the price will hit the first TP further down.
The most important thing regardless of where you are comfortable with taking profit is that you outline and form a plan to protect yourself and eliminate your risk at the first trouble spot.
Take a look at these charts and you'll see why the 985 zone caused a bounce. I felt that the location and size of the pin could have pushed through this zone, but it did not, and I made sure to protect my capital beforehand by moving my stops to BE. Don't simply see these areas and hope for a break through them.
We prefer to see bullish outside bars at swing low points signalling a reversal. This bullish outside bar is at a swing high and so is best ignored when starting out.
Bar identification is only a small part of the method. The key is finding good bars in good locations. A good location has some confluence of a price pivot zone, EMAs, fibs or whatever you like to use to stack the odds in your favour. Keeping the chart as zoomed in as you have it makes it harder to see these good locations because you can't tell what is going on around price. So...
Ignored
Hello Aaron, thanks again for the responce. Just need to clarify a few things.... Jim's chart that you sent me is showing one BEOB at a swing high position but the first BUOB is halfway up the incline..? How would one know the difference?
I've attached another chart here of the current gbp/usd daily... there are two OB's that I've highlighted, the one idicated by a white arrow is bearish... but actually reversed... the other one (yellow arrow) is bullish on the 365 day EMA and long term fib (end2007 to the low earlier this year i think) and this did head off in an upward direction.
What was the differences.... and how would one enter these without getting stopped out...?
Those first levels almost always see a bounce of some kind. The question is always is it just a temporary bounce or a full on stop-killing reversal.
If that first level is far enough away from my entry then I have some breathing room to work out which one it is. My stop gets to break even and the trade still has room to move.
If that first level is 15 pips away, well it's going to put me in drawdown even if it's only a small bounce. And I find that hard to handle.
I've had too much time in a cold room with...
Ignored
Trying to stay out of drawdown .... depending on if it is a small retrace or a big one on that after it hits the first trouble area.
But do have 1 question though, no matter how much space the bar is in, there is usually some bar highs or lows to the left of it which we can miss out where on hindsight we will say, hey I missed that high ...
No offence to James or anyone here but just trying to figure this out.
Let me see if I can find a chart of what I mean.
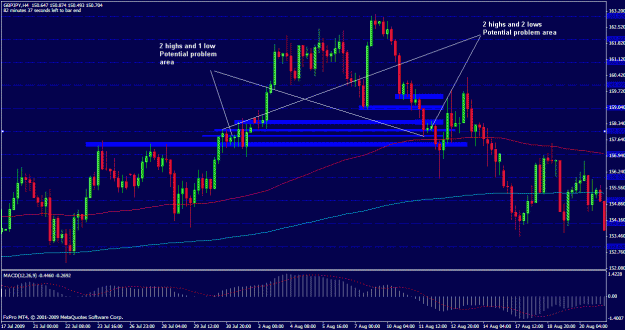
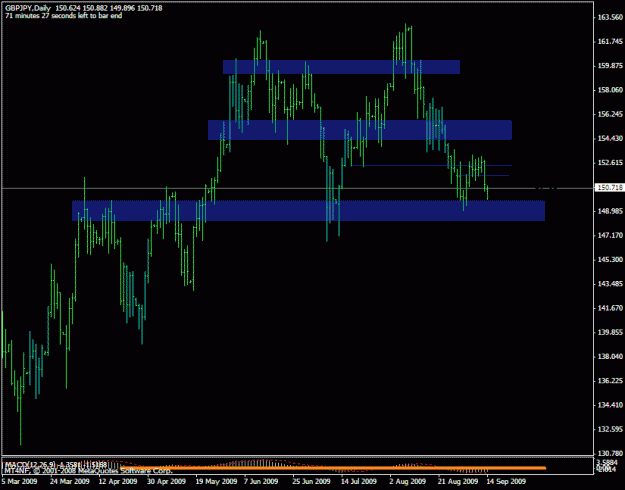
If you see this chart of GBPJPY, I can start draw all the 2 bars highs, 2 bars lows that could proof to be problem areas and if you see even at the closest point to it high, you can see problem areas. Which area is it going to stop which area is it going to break through. I understand that this may come down to experience but I am struggling here.
Pin bar is in Space, nice big pin bar ... good location etc
This is what I am trying my best to understand. Hope James, mike anyone can shed some light on this. If we try our best to find bar highs and lows, there will DEFINATELY be one that is close by and if the trade fails, it becomes apparent that we missed that area out.
I really this PA works but when we get to the nitty gritty part of this, I am LOST!!!.....
Thank you
One question. Can this be considered 2 consecutive matching lows? He have an established trend but its a little weird because its friday and monday candle. But the difference is only 0.8 pip. Or am i missing something?
Thanks both for the fast responce. How do I diverse the minor from the major PPZ. I really understand what is the difference but may you give me some examples of major and minor PPZ please. Thanks in advance.
Ignored
Hey Atton
The way I do it is more generalized. For example below is a chart. The big blue boxes are clear major PPZ zones. These can't be missed, and we can't forget they are zones. Then lets say we are in a trade going long now(forget no PA just trying to explain). Well now what I do is focus my attention to what else is around my entry. These are bar highs, lows, previous minor flips. I marked some in small thin blue box. So although some of them might run into major ones, what my attention does is focus in, onto a more micro perspective of the chart where price is now.
Defining these areas, is literally the key to trading IMO. S/R is everything. The bars are nothing more then triggers. It is really like learning a new language, slowly it becomes easier to read.
Hello Aaron, thanks again for the responce. Just need to clarify a few things.... Jim's chart that you sent me is showing one BEOB at a swing high position but the first BUOB is halfway up the incline..? How would one know the difference?
I've attached another chart here of the current gbp/usd daily... there are two OB's that I've highlighted, the one idicated by a white arrow is bearish... but actually reversed... the other one (yellow arrow) is bullish on the 365 day EMA and long term fib (end2007 to the low earlier this year i think) and this...
Ignored
Hey Dave
That first BEOB is at a swing low point. We want to see a BUOB there. So if we took arrow two bar the buob and swapped it in that is where we would want a BUOB to be, a swing low.
Your second arrow is now a swing high, and this is where we would want the BEOB to be. So essentially we would want to switch these bars and their locations to become "possibly" more tradable.
As for how to trade them, you can like all PA trade them a few ways. On a break, on the close, on a retrace. I prefer to trade all my bars on a break, with my stop loss on the other side of the bar(remember to position size correctly! )
Now yes you can eventually trade these bars as continuations not reversals, but please I suggest to avoid doing that till you understand and can trade them the way J16 teaches here as reversals. So in his chart, the first BUOB was a continuation, and the second one was a BEOB true reversal at a swing high which is what we want.
One question. Can this be considered 2 consecutive matching lows? He have an established trend but its a little weird because its friday and monday candle. But the difference is only 0.8 pip. Or am i missing something?
Ignored
Hey fxlan
Yes that is a TBL(two bar low). For now a sign of a "pause" in the trend, when they break they can often signal a continuation(temporary or longer).
I made a post a while back about this one and how I managed it....
Ignored
thanks scott. i understand your post and it helps.
looking at it after that fact, my major problem on this was that i didn't see 985 as a trouble area. chart 1, i saw triple top, so 985(top2) was part of the resistance/ppz i was trading away from.
however chart 2, 985 was also the bottom of the bullish pin noted by arrow, which i didn't identify as trouble area. even if i did, with the space before the PA, i would likely to think price should move through it with easily.
and yes, the first trouble area is usually my first TP or first point to move stop.
Joined Jun 2008
|
Status: Grateful to Merlin, Jim and Fudd :)
|714 Posts
Tradertt and Mpondondo,
Mike got to those questions first and answered them better than I could have done. So I won't add anything except to say that this stuff can seem a little frustrating at first but all it takes is a little time and practice and it gets clearer. I'm still on the learning curve but it's nice to look back and see how far I've come.
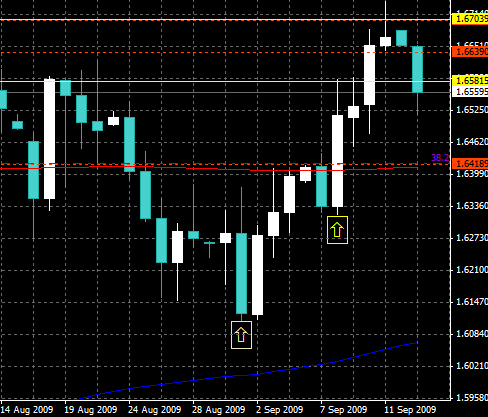
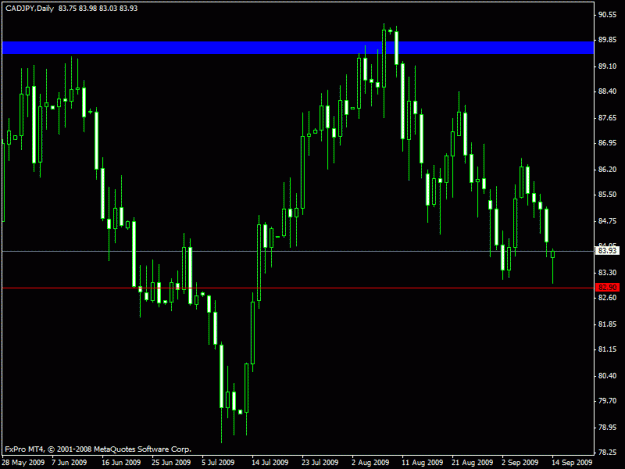
I'm watching CADJPY a daily pin is forming.bar ends in 15 mins on my charts.
I have a reservation - whether it actually is a valid pinbar...
the open is very slightly just below the close of the previous days bar rather than in the range of the previous day...does this matter?
but it is at a ppz, of sorts and a swing low.
I won't be too ambitious with my target, maybe 84.35, as its in a downwards channel.
hey I was eyeing off this cad jpy aswell.
I agree, perhaps the pin couldve closed further into the previous candles body but it is longest and cleanest pin I have seen for a while.
may have to manage this one tightly seems a few potential trouble spots are lurking not to far away
|
Joined Sep 2009
|
Status: Sniper in training
|33 Posts
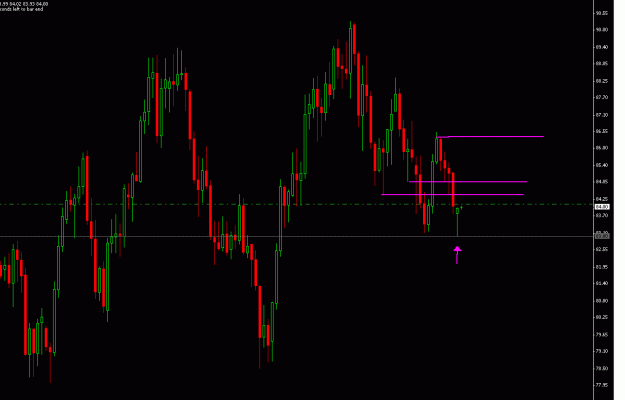
I'm read about, but never tried trading, "almost pin bars".... is an "almost BEOB" relavant in any circumstances? (yellow arrow)
This is once again the gbp/usd daily chart...(I really like this pair)....
I'm read about, but never tried trading, "almost pin bars".... is an "almost BEOB" relavant in any circumstances? (yellow arrow)
This is once again the gbp/usd daily chart...(I really like this pair)....
I'm read about, but never tried trading, "almost pin bars".... is an "almost BEOB" relavant in any circumstances? (yellow arrow)
This is once again the gbp/usd daily chart...(I really like this pair)....
I'd stay well clear of almost bars. I don't touch them myself. I've been burnt too many times by less than stellar bars at locations I where have been watching and waiting for price action.
It gets into a mindset where we start to curve fit and see things that aren't there. The best thing to learn IMO is how to keep passing on these less than perfect setups and wait for the ones that sit up and scream 'trade me'. Only a handful of those a month and we are growing our account nicely.