I decided to close CADJPY/AUDJPY for a +26 pips gain. So I am +138 pips for the week, but AUDNZD (-52 pips) and GBPUSD/EURJPY (-85 pips) are still running.
Here are a results of a few calculations I just made. I am trying to figure out how to select the best pair combination for this strategy. I picked pairs that I thought would be interesting. The upper part of the table show a fairly good correlation values for every combination. The lower part show how much it can vary from a period of time to another. Orange data are low or reversed correlation values. The best combo as I would have guessed is EURUSD/USDCHF wich shows a steady high correlation for any period of time. AUDUSD/NZDUSD is another good choice, although the correlation was reversed (-0.559) during 27/02/08-16/07/08 but lately it has been stable. AUDUSD/EURUSD is also interesting, showing recent high values.
I am sure there are other interesting combinations. The same exercise can be done with hourly data and I am sure EURUSD/USDCHF will show high values all the way.
i traded eur/jpy vs usd/jpy all week and its sitting +187.31 - 190.01 took an entire week.
also last night i traded gbp/usd vs gbp/jpy and was using the 1 minute chart..was looking for a quick in and out trade. i traded the gap grew big i waited 3 more hours and it was down - $220 i zoomed out to check the 5 minute chart and back to the 1 minut chart on marketscope.. and the 1 minute chart COMPLETELY shifted to something else.. it said the currency had crossed about 5 times.. when i was watching it for 3-4 hours straight with a huge gap there was no way it crossed.. so what happened??
Anyone know why that happened? i have a screenshot of the huge gap on 1 minute then checked again and the gap never existed it says.. so i just closed the trade for - $220 LIVE acct. taking the loss. otherwise i would have held onto it. looks like it made a comeback from when i got out too. guess i will need to learn.
but some of these trades can last WEEKS so be prepared... im trying to only trade correlating pairs that are REAL tight.
The problem of this system is that the chart itself changes as time goes by. The charts adjust themselves to make the graphs look centered so when you first open the chart and overlay pairs, they look like they cross each other and it works. But when you actually trade, you will realize that these charts adjust themselves so even though the lines of the pairs you bought/sell didn't really cross, they make them look like the have been crossed later.
The gap actually gets wider and your profit is negative but the charts change themselves and make them look like the lines have been crossed.
When I buy it, it moves down.
When I sell it, it moves up.
There are a few articles on the WEB concerning pair trading with stock. Here is one of them. They talk about dividing one pair by the other and enter a trade when the ratio goes beyond its average by 2 times the standard deviation. I think it's interesting because it prevents early entries when the spread can get larger.
There are a few articles on the WEB concerning pair trading with stock. Here is one of them. They talk about dividing one pair by the other and enter a trade when the ratio goes beyond its average by 2 times the standard deviation. I think it's interesting because it prevents early entries when the spread can get larger.
Ignored
Chamane you hit the nail on the head.
I am currently using a spread trading system for stocks that basically divide 2 shares to derive the ratio. The system also shows you the current correlation and the spread difference between the two.
Ive read around half the posts on the forums so if this has been discussed already I apologize. It seems we cant simply rely on the two currencies to come back together. We need a double moving average of some sort that will cross hence giving us a signal when to exit the market.. This will effectively remove the need for both prices to converge on a chart.
Relying on the fact that the two currencies will converge will no doubt end in some serious loses one day especially if there are no stops being used.
This is what I think we need built on MT4:
An indicator that plots the ratio between the two currencies as a line
e.g AUDUSD / EURUSD = 0.8624/1.4569 = 0.59
This will enable us gauge when the currencies are drifting apart and by how much.
Next we calculate the number of deviations from the mean. A signal is created when this number is above 2.0
Next we need the average price ratio of lets say the last 21 bars (exactly like an EMA) plotted on the same indicator.
If you look at the attached chart you will see that as the price ratio moves 2(or more) standard deviations away from the average (blue line) a signal will be created.
We exit the position either for a profit or loss when the current price ratio crosses back to the blue line.
This way in the odd event that the prices dont cross on a chart we will eventually close our position when the price ratio crosses its EMA
Hope this makes sense as I believe this is the answer to exiting a losing position.
Chamane you hit the nail on the head.
I am currently using a spread trading system for stocks that basically divide 2 shares to derive the ratio. The system also shows you the current correlation and the spread difference between the two.
Ive read around half the posts on the forums so if this has been discussed already I apologize. It seems we cant simply rely on the two currencies to come back together. We need a double moving average of some sort that will cross hence giving us a signal when to exit the market.. This will effectively remove...
Ignored
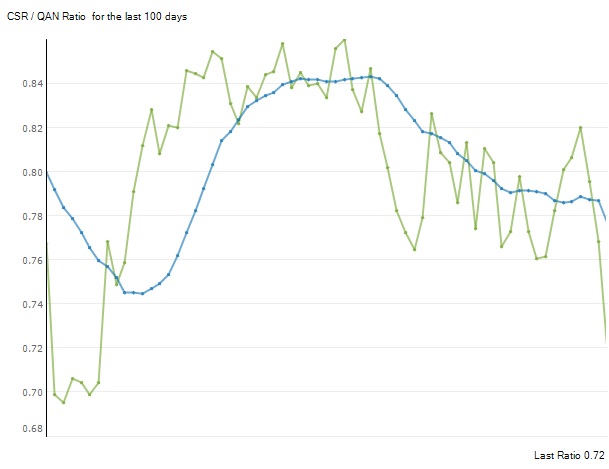
That's seems to be another interesting approach. I hope I am not interfering with the spirit of this thread. I am trying to find ways to trade this strategy with hints avoiding drawdowns (if this is possible) knowing price will snap back to profit with a good probability. According to the article I was refering to, I used the AUDNZD pair as the ratio of AUDUSD/NZDUSD wich are highly correlated together. I calculated the average of the ratio (price of AUDNZD) and its Standard deviation for the period of time shown in the picture (december 16 2008 up to now). The standard deviations each side of the average (blue horizontal line) are shown in green (1stdev) and red (2stdev). I overlaid AUDUSD (red) and NZDUSD (yellow) with the OverlayChartline indicator. Arrows show an example of an entry signal, but of course stdev signals have to be applied to the most recent price.
Benosio approach is a little different. I think both could be easily programmed in a EA so it would be easier to test both assumptions. We have to remind ourselves that the strategy is based on past data relying on high correlation to project a snap back process. Nobody knows when that correlation will end. But we are counting on probabilities. What bugs me is that there is still no stop loss in the original strategy. Some mentioned 10% of capital, but I find that a lot.
charts changing yea i noticed that happening.. i dont think i will live trade this idea anymore.. just due to this. if you watching a pair then the chart changes you have nothing to go by anymore.. so i got completely lost.
|
Additional Username
|
Joined Oct 2008
|280 Posts
[quote=chamane;3049528]...knowing price will snap back to profit with a good probability.[quote]
You know this? You know for sure that price will retrace into profit?
Actually this is impossible to know for sure, and that is the problem with this method.
Several followers of this method saw the EURUSD go badly against them this past week, and the USDCHF too if they were betting both at once. Following this method means that you are going against the trend and praying for a quick retrace. You see now what can happen when that quick retrace doesn't go as expected. I think I would rather go with the trend and carefully pick out the tops and bottoms.
No one can "know" the market, and if they could they wouldn't be here bragging about it. They'd be way too busy counting their cash.
" Average traders look to the left, great traders look to the right."
charts changing yea i noticed that happening.. i dont think i will live trade this idea anymore.. just due to this. if you watching a pair then the chart changes you have nothing to go by anymore.. so i got completely lost.
i like the idea chamane....
Ignored
That's why I check the short term, the mid term and the long term correlations. Knowing all correlation values are high, I suppose that there will some kind of cointegration (snap back), but I am not sure about that. Cointegration is starting to be to complicated for me mathematically. You can have a high correlation but a bias widening the spread between two pairs. But even if they are a long distance apart, you can still enter a trade when you think they will get closer together. Some charts give the illusion that they are on top of each other, but they are miles away. But still tradable.
[quote=magicchance;3049575][quote=chamane;3049528]...knowing price will snap back to profit with a good probability.
Quote
Disliked
You know this? You know for sure that price will retrace into profit?
Actually this is impossible to know for sure, and that is the problem with this method.
Several followers of this method saw the EURUSD go badly against them this past week, and the USDCHF too if they were betting both at once. Following this method means that you are going against the trend and praying for a quick retrace. You see now what can happen when that quick retrace...
I don't know this. I am testing the strategy trying to find if it is worth trading it. There are many unanswered questions. I thought it would be easier since Dreamliner told us he's had barely any loosing trades. It would be nice to have him again with us.
Chamane you hit the nail on the head.
I am currently using a spread trading system for stocks that basically divide 2 shares to derive the ratio. The system also shows you the current correlation and the spread difference between the two.
Ive read around half the posts on the forums so if this has been discussed already I apologize. It seems we cant simply rely on the two currencies to come back together. We need a double moving average of some sort that will cross hence giving us a signal when to exit the market.. This will effectively remove...
Ignored
Bollinger Bands will do what you say.
In the case of EURUSD-GBPUSD, put up the EURGBP chart with Bollinger Bands. It is a 20MA with the upper and lower bands set at 2 standard deviations.
When it touches the top band, it means the EUR is strong and the GBP is weak.
When it touches the lower band it means just the opposite. There are your gaps. Real gaps, not flaky superimposed charts.
Ignored
If this works out, I would be tempted to use 3 stdev.