Dislikedyou know strat, when i came across you thread ,something caught my interest, the issue of SUPPORT AND RESISTANCE.
with all sincereity,i have had a lot of problems locating support and resistance, even after reading some part of this thread, i cant still get something, but of recent i stumbled on another thread on forexfactory where a guy mentioned something about using the pivot support and resistance ....and i tried it and since then,it has been working wonders for me....Ignored
Anyway, Craig gave you the perfect answer and its better coming from him than me as in his early days, he struggled finding these S&R levels.
To help you better appreciate the value of S&R levels:
Pivot levels, pivot support and resistance levels, Murrey Math Lines, Gann Square of 9, Camarilla, Fib Pivots, and all other manner of fancy pivots are hyped up calculations of what WE SEE on our Price Charts. They are the lazy trader’s ignorance of what really happens when price reaches a certain level. Believe me, I have used and tried all these and many others and I always, ALWAYS come back to using S&R identified on a price chart by the Mark I eyeball.
Pivot calculations were used by the Floor Traders in the Pits many years prior to price charts being generated by computers. This was a “niche” or “edge” among these guys as from doing these calculations, they knew where to place their buys, sells and stops and it became a “self – fulfilling” prophecy. Eventually, word leaked out and the “big” private funds and traders started using them which then became more “self – fulfilling”.
Fast forward 30 or so years to where we are now and everything done by the “Big Boys”, Banks and Financial Institutions is triggered by computer algorithms and neural logic using the latest software and hardware technology available. Their trades are electronically triggered based on price levels, spreads, anomalies, aberrations etc., etc., as I stated in an earlier post.
This is EXACTLY why I don’t trade short time frames and why I feel sorry for the mugs that do. They have NO CHANCE trading against electronically generated trades. By the time your average Joe trader gets a signal from his Mark 9379, Version 999 “black box” and indicator, the Big Boys have already taken the OPPOSITE side of the trade!
Now, zoom out to the Daily and above time frames and you take away most of the electronic advantage the Big Boys have. “How and Why?” you say. If you have to ask that question then you truly don’t know enough about a business you are pouring money into and hoping to make money from.
You must understand that no matter how fancy the Big Boys’ software and hardware is, it is STILL using the same data as us little insignificant squirts are – PRICE. Yes, they also use TIME in their lightning fast software. Their basis for calculations is, and always will be PRICE and PRICE HISTORY.
On an end of day basis, we know as much about PRICE as the Big Boys and all their multi billion dollar trading equipment do!
“What has all this to do with my question about calculated pivots?”, you are grumbling. Everything, absolutely EVERYTHING.
From the very first trade ever made on any financial instrument, a FOOTPRINT of Price Action and Price History has been left behind. You can see this on the price chart of any instrument whether it is rice, crude oil, platinum or even bread in the Middle Ages.
Had you put in the effort and taken the trouble to understand Price Action at Support and Resistance instead of taking the lazy, ignorant trader’s way out using out dated calculations, you would understand all this.
Let me explain AGAIN.
It doesn’t matter what system/strategy/method you use, which black box, which indicator, which calculation, which scam artist’s software etc., etc., there HAVE BEEN and ALWAYS WILL BE, levels at which a particular financial instrument is bought and sold based on supply and demand for all and any economic condition and conditions.
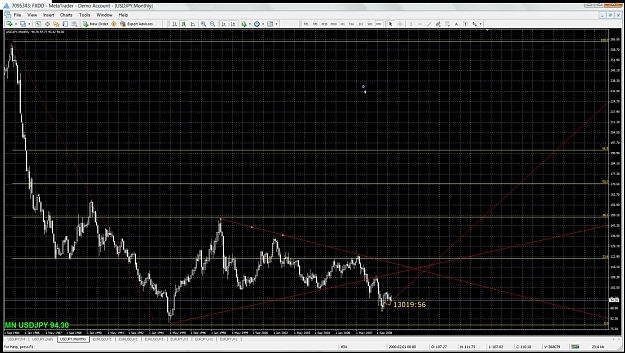
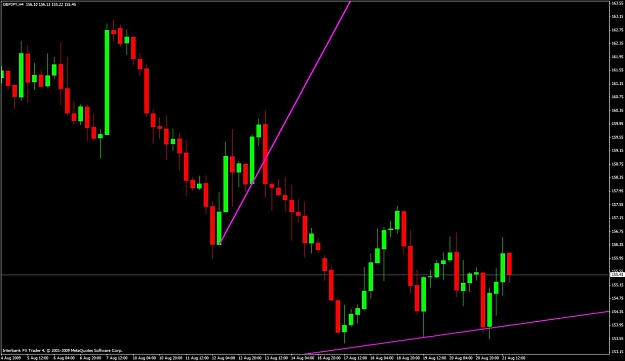
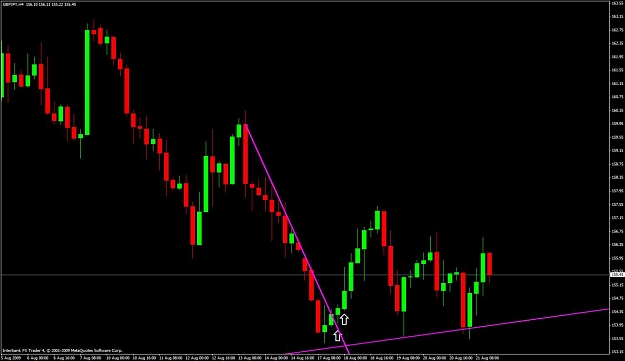
Still don’t understand? Find the post earlier in this thread and you will see that in 2009 we were using price levels from 1994 from which to buy and sell. Look at my recent post on USDJPY where I am using Dynamic Support and Resistance levels from 1985 and 1994.
It doesn’t matter how these levels were arrived at; they could have been calculated using NASA’s space age computer systems or Mickey Mouse’s abacus, the fact is that these levels were left behind for us to SEE and use.
If you still think you need to calculate pivot levels then let me remind you that the most successful and profitable traders (including those here on this FF forum) all use very simple methods – PRICE at previously established and proven levels. Hell, some don’t even own a calculator! There is one trader on another thread here on FF who doesn’t even draw these levels on his charts – he just eyeballs them! He makes $millions each year without making one single calculation!
15 YEARS OF PASR ON FOREX FACTORY!
1