DislikedEURGBP was not going as expected, so i killed it for -72pips. if the bar on friday was neutral to even a little bullish i would let it run, but instead it formed a bearish bar and even closed at the low of the day. wondering if how the PA old timers would manage this differently?
in retro, EURJPY didn't trigger, and CADJPY would' triggered and stopped out. so got lucky on this one.Ignored
Not that I am great or anything but here's my two pips.
Short answer - It's chopville USA to the left, and the trend is down.
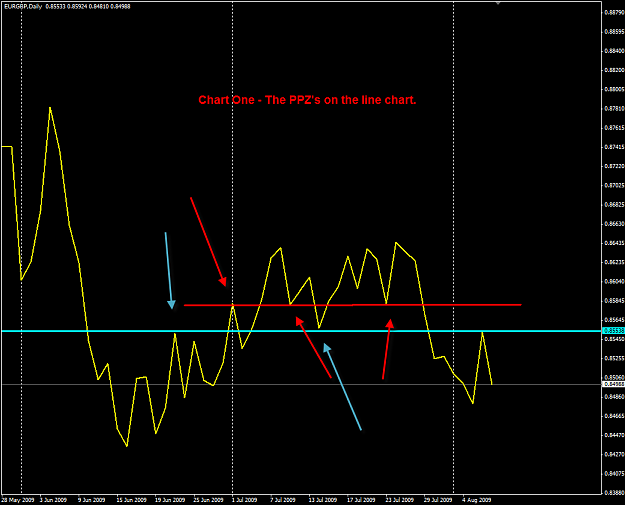
Long Answer - Explained on the charts, I use a line chart a lot of the time to see where the bounces are taking place, sometimes there are just so many wicks all over the place here on the candlestick chart, if I plotted them all it would look like a scene from star wars
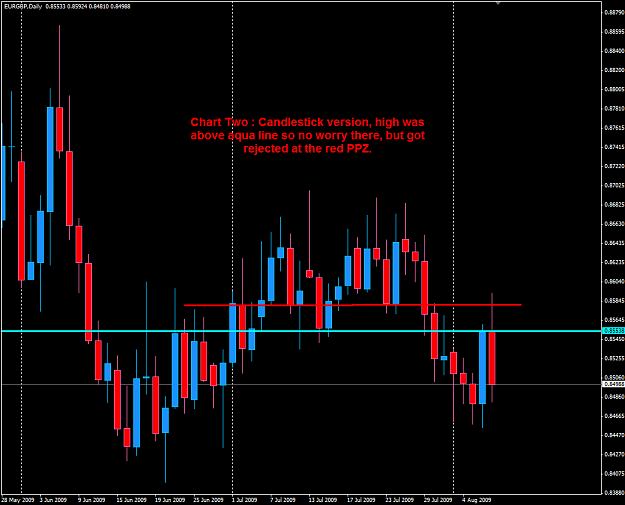
Theres three big levels on EURGBP, the two outlined in the first chart and then .85. The only setup I would be comfortable playing would be a BEOB with the .85 running through it, although to be honest I think this could range here for a while.
Round numbers are dynamite and have saved my stop on sickeningly high numbers of occasions, but when trading vs. the trend and trading back into a load of bar lows it lowers their power.
Best regards,
Jig
EDIT -
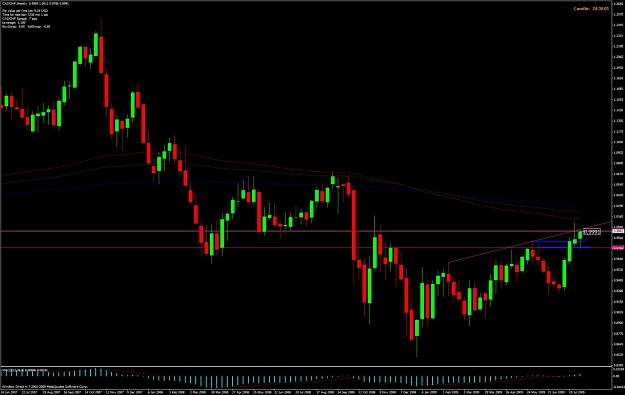
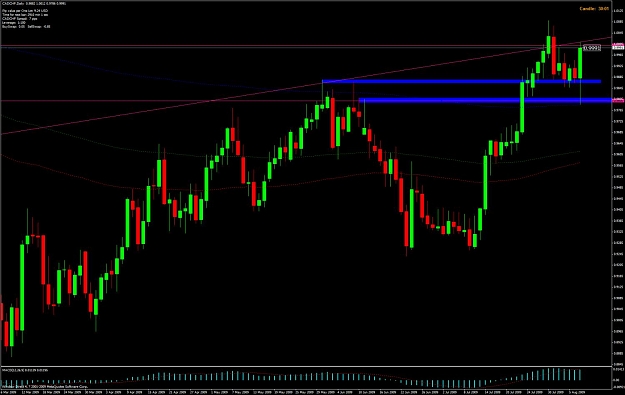
That chart as a whole is just a sloppy mess like two inverted hedgehogs trying to fight or something, the red line PPZ is just a mass of highs and lows. I can see another one around 1.8575 or so, and then theres the 1.85 itself with the round number + Fib confluence. It's all a mess, I didn't like the BEOB which was trading down into the 85 before this either. Hmmm. Theres open country to be had down south of this though . . .
Attached Image(s) (click to enlarge)