DislikedHey guys, Sorry I wasn't quite clear with what I was doing here.
I was trading off of the daily charts, if you look at the daily chart that I posed I saw, from the low of June 8, 2009@ 1.580 drawing a fib to the high of 1.6740 on June 30, 2009, price retraced and formed a bullish pinbar on July 8 which poked through the 23.6.
Then on the 13th of June price retested that point and formed a Bullish outside bar, and 3 days later broke the 61.8 and found new support there.
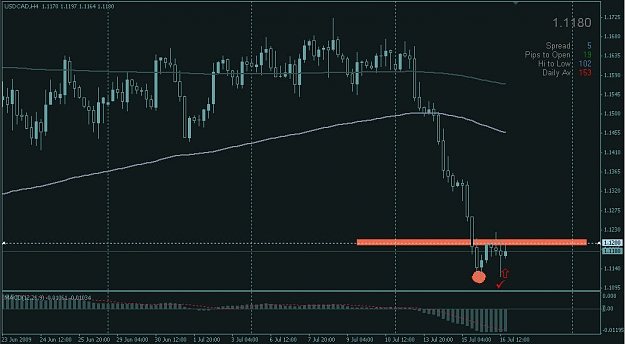
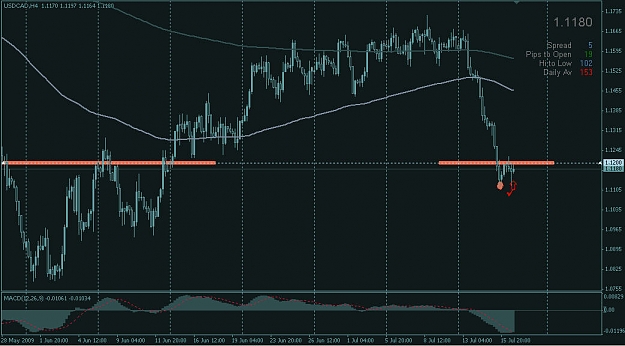
I only looked at the H4 and H1 to time my entry, and got more positive confluence...Ignored
What I am going to say here will save you a lot of thinking. Which is a Great thing in trading. When you see that bullish pinbar, if you believe that is an entry worth taking. Stick to trading JUST that time frame. That is place your buy above the high(with a buffer), and place your stop loss down, and then just manage that trade from the daily chart. James calls it day trading a daily chart. What this does is simplify the whole process. It also will get you in at the start of the move as opposed to chasing the move down later. Now their are variations to all of this, but after doing this for awhile now, it is a simple and effective method that works the best. Forget about dropping down, it will add a lot of paralysis to your analysis by trying to process all that information. It can be done in one easier cleaner way. This helps make it easier to know what to look for, and all ends of trade mgmt easier.
Best
Mike