lets see how this one looks
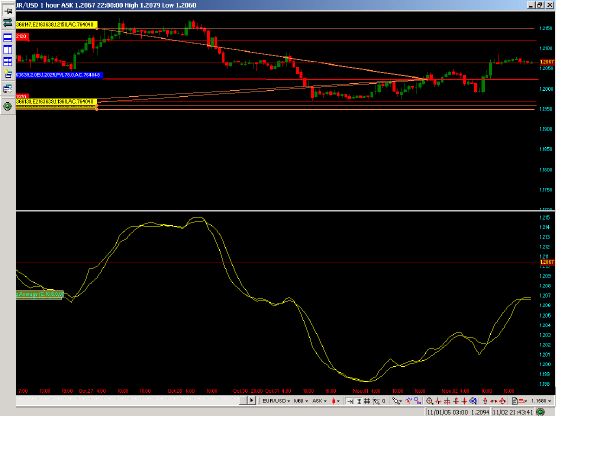
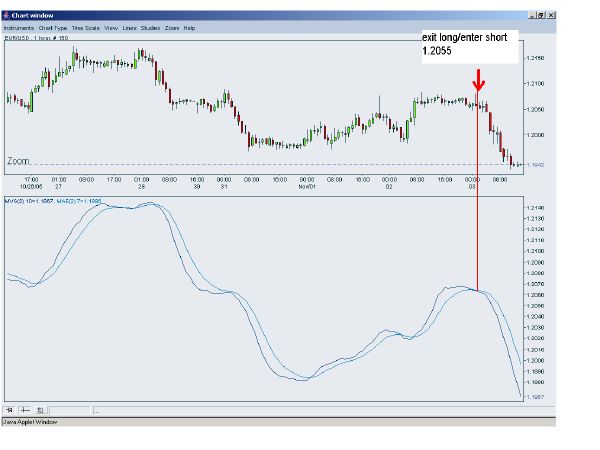
you see this chart shows crosses during that consilidation but the fxstreet chart don't.
All settings are the same ....7 ema/10sma....1 hr chart. I wonder why they look different. Now thats gonna bug me untill I figure it out.
I will stick to fxstreet chart and see how that goes. I wish FXCM power charts allowed you to put ma's in a seperate box.
Dave
oyea that red line on the black chart is the buy entry I made on the last crossover buy signal. entered at 1.2024 s/l @ 1.2000 pt: @ cross under holding 40+ pips for now.
Attached Image