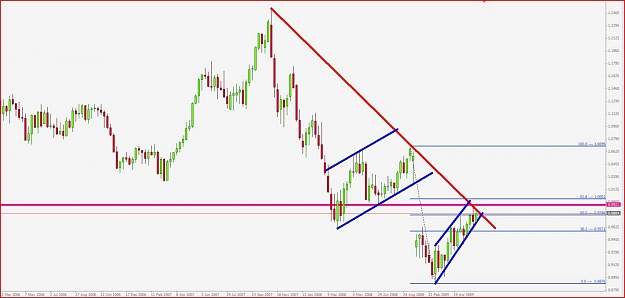
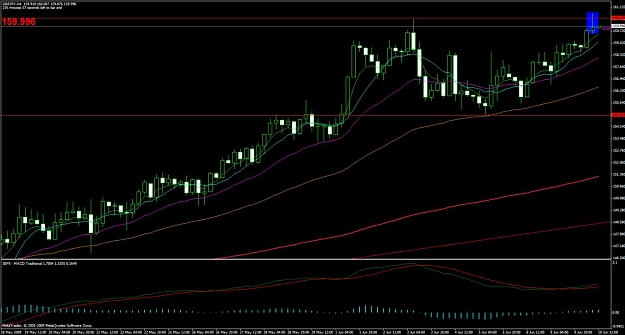
DislikedPlot a hoz line at 1.56350 and scroll back in time a little. Seems to be a fairly strong resitance/support. Zoom out to weekly and you'll see it also is strong there too. T1 = 1.56350, T2 = 365 expo ma ~ 1.57500
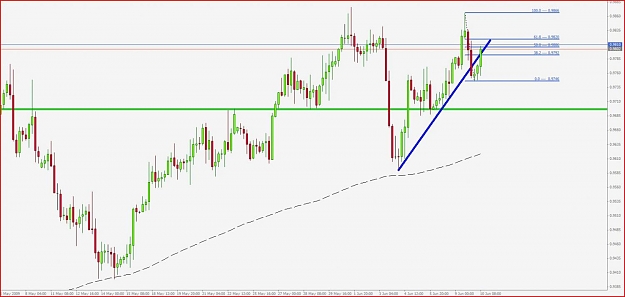
Looks like bullish divergence forming on daily. Pin bar has broken and is in a retrace so you could look for a possible entry at a fib, giving you a tighter stopIgnored
Indicators show the past. Price Action "Indicates" the future.