DislikedRegarding that, this is what I did:
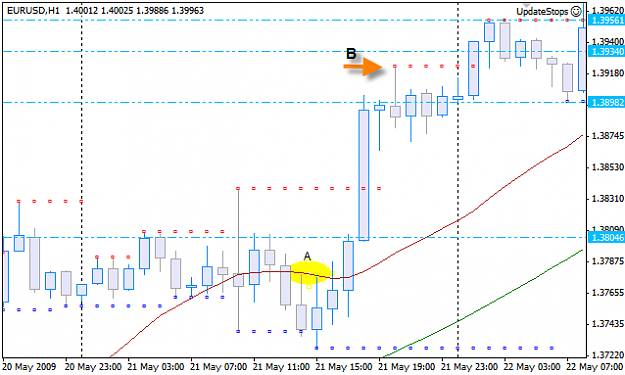
On the H1 chart, I found a break of the SMA(20) (the redish one) and the corresponding long signal fractal.
Attachment
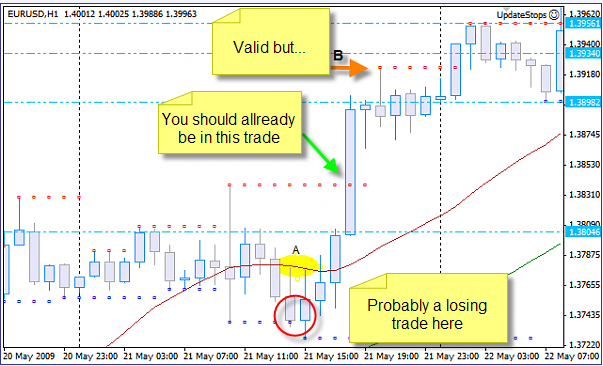
I found the previous opposite fractal too far so, trying to find an alternative, went to the M30 chart and used the next opposite fractal to define the SL level.
Attachment
The distance between them is around 70 pip and I thought 140 pip could be too much to expect to TP, so I chose to go for a 1:1 R/R, apparently not as good as in the M15 time frame.
Does this...Ignored
I will make this more clear on the first port