We'll have to see if they were driving price down pre-London open before buying it to make it into a continuation flag instead.
Ignored
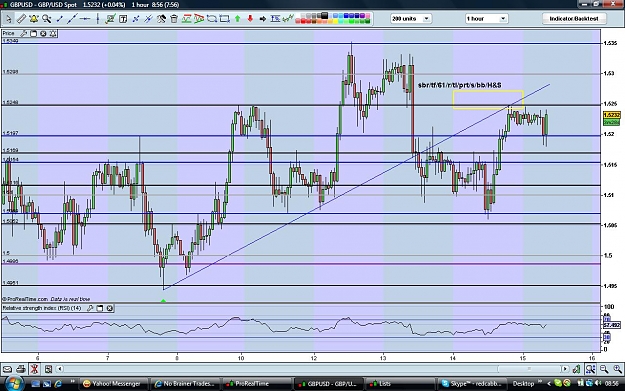
Being Friday I had a funny feeling about this H&S not working out exactly as expected. So long as you cover yourself in conditions like this then you're ok.
been a couple of days now and we never got much of a super-hard selloff, so larger positioning hasnt seemed to reverse much at all.
If 3400 gets seen on EUR I would think we're looking at a change in bias, until then, hard to say positively "short"
also remember that cup and handle pattern developed now....or the 'waiter hand' pointed out by spekitox here.
GBP is having a hard time failing.....
on the other hand we've seen the stock indices falling over, and I would expect them to kneel down further at some point. That should improve the strength of the dollar if the trend continues into next week. Retracement due first, though (upwards), I would imagine.
Well if I took that GBP/USD trade that would of been a loser and hit my S/L. It was around news though so I am sure that if it was a live trade it would of been passed over. Sucks about the times I trade, when I wake up at 6:00 my time its 8:00 and news is right around the corner, so there is a lot of sideline watching. And by the time news is done I gotta go to work!
This is all new to me - my first day trying S& R This trade below I missed by a pip only But would it of been one for the no brainer boys, or am i looking at it wrong. I had my order in bang on the red line.
Joined Mar 2008
|
Status: Lord of the Dance
|659 Posts
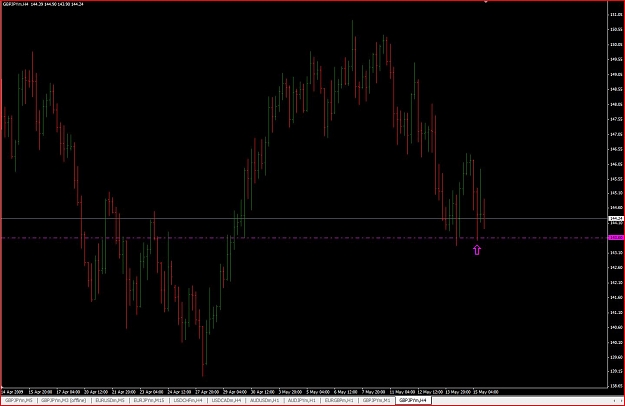
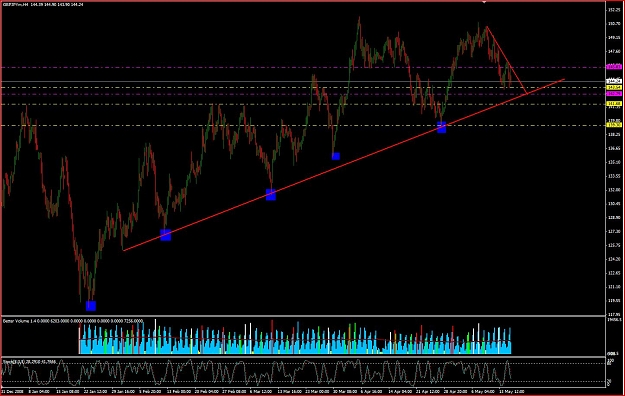
A good trade off Support on GJ yesterday.
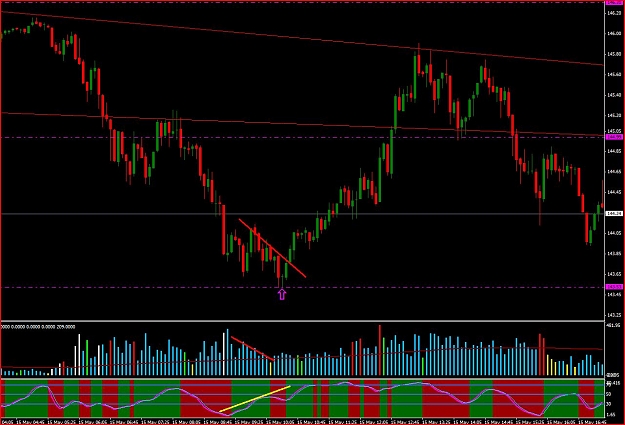
Moving to a lower timeframe you get a good indication using VSA analysis that there is not much strength in the move down and the pair will reverse and follow the path of least resistance.
On the 5m chart you will notice there is divergence between price and volume. Decreasing volume on a move down is bullish. This shows that there is not much interest by the professionals in the market and without them the pair will stuggle to breakthrough an area of support.
Joined Mar 2008
|
Status: Lord of the Dance
|659 Posts
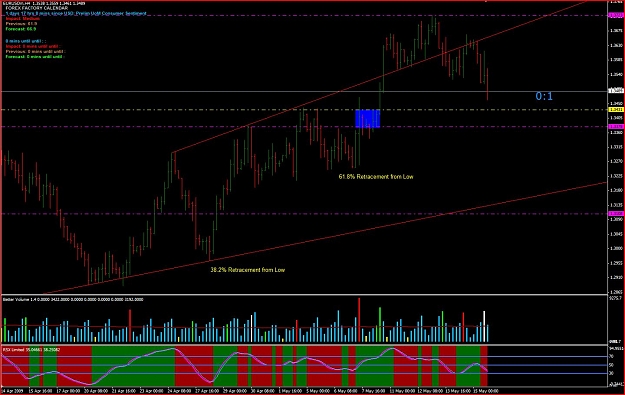
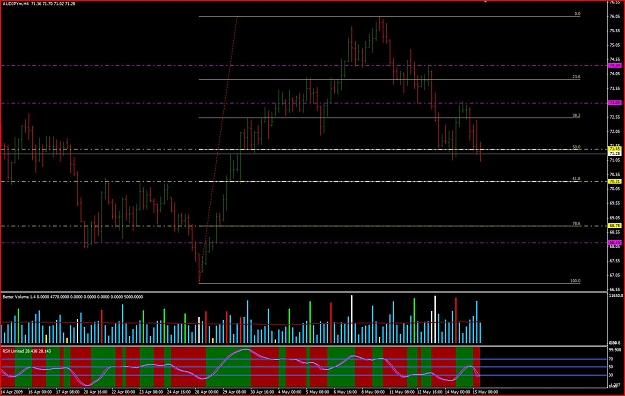
The yellow dotted line is significant support on the 4h EU chart.
It is also the 38.2% and 61.8% retracements from the Higher Lows marked on the chart (Almost to the pip)
The blue area was a previous area of very high volume. This will add to the support of that line. There could be a significant amount of traders who sold in the area and are trapped in a bad trade. They will buy back as soon as price returns so they can exit their trade for little or no loss.
This will drive price back up.
To break through this support line the market makers/professionals will need to mark down prices rapidly on high volume. Watch price on a lower timeframe to see how it approaches this line.
Joined Mar 2008
|
Status: Lord of the Dance
|659 Posts
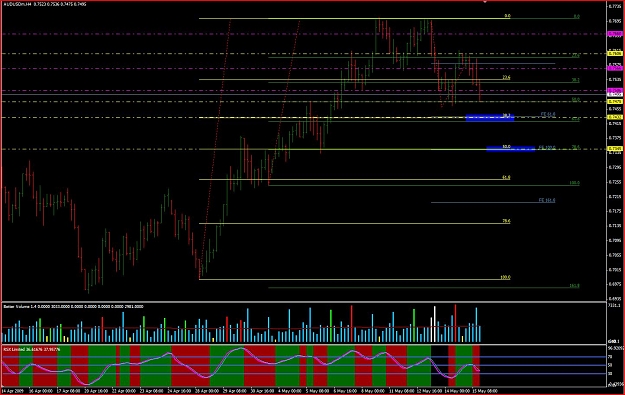
Ok, last one.
The yellow lines are S&R areas from multiple overlapping Fib Retracements and S&R lines on 4h chart. Fib Retracements are taken from the blue boxs marked on the chart.
Purple lines are just S&R lines without overlapping Fibs.
A good trade off Support on GJ yesterday.
Moving to a lower timeframe you get a good indication using VSA analysis that there is not much strength in the move down and the pair will reverse and follow the path of least resistance.
On the 5m chart you will notice there is divergence between price and volume. Decreasing volume on a move down is bullish. This shows that there is not much interest by the professionals in the market and without them the pair will stuggle to breakthrough an area of support.
Ignored
I see the relationship between decreasing volume and price. However, given the situation whereby there is increased volume with a bearish candle heading towards a higher time frame support (possibly showing a large number of novices jumping in in front of a turning point for long buyers). My point is the relationship with price and volume (bearish candle high volume or bullish candle low volume) can work both ways when considering SR levels?
This is all new to me - my first day trying S& R This trade below I missed by a pip only But would it of been one for the no brainer boys, or am i looking at it wrong. I had my order in bang on the red line.
Ignored
The support was found on a higher time frame. You should have jumped down to either a 5 min or 1 min chart and observed the bounce at support, to then jump in front 1pip + spread of the high of the 5 or 1 min candle that bounced.
I see the relationship between decreasing volume and price. However, given the situation whereby there is increased volume with a bearish candle heading towards a higher time frame support (possibly showing a large number of novices jumping in in front of a turning point for long buyers). My point is the relationship with price and volume (bearish candle high volume or bullish candle low volume) can work both ways when considering SR levels?
Ignored
Hi Porkpie
It all really depends on what happens immedialety after these candels. The professionals with test these areas to see if there is further supply in the market. Candles and their Volume should be read in context of what has happend before. You can see there is buying coming into the market before it reaches the support line.
In order to break through this line there should have been a widespread down bar with much higher volume followed by more of the same. As the next bar is bullish this shows that the move is weak and that supply (selling) has dried up.
Markets follow the path of least resistance and professionals are not going to fight the market if the see that the supply has dried up.
The yellow dotted line is significant support on the 4h EU chart.
It is also the 38.2% and 61.8% retracements from the Higher Lows marked on the chart (Almost to the pip)
The blue area was a previous area of very high volume. This will add to the support of that line. There could be a significant amount of traders who sold in the area and are trapped in a bad trade. They will buy back as soon as price returns so they can exit their trade for little or no loss.
This will drive price back up.
To break through this support line the market makers/professionals...
Ignored
I've been waiting for this level as well...nice support rnage down to 1.339
It all really depends on what happens immedialety after these candels. The professionals with test these areas to see if there is further supply in the market. Candles and their Volume should be read in context of what has happend before. You can see there is buying coming into the market before it reaches the support line.
Thanks Copi. I think it works well with SR levels. But I am still unsure how volume can work with forex as prices are not being fed from a centralised exchange, unless you are using currency futures?or relying on your broker's volume but this would still be misleading?