Because it is by far too inefficient to reinvent new levels every other day. And why would one? Market's worked fine so far with the old ones.
In fact I am a believer in (my own) the theory, that there is ONE 1000 pip grid that simply gets overlaid over and over again on a pair.
Seems to apply to 1.8xxx and 1.9xxx cable at the very least and the story for EURUSD seems plausible as well. It also explains how one derives s/r for "new" price levels. You simply take the old ones.
If things sound too simple for people to believe it, it is most likely true.
Ignored
Amen. The S/R is already there and at the same points every time. But they don't always follow a 1000 pip grid. You have to change the grid as the market changes. Sounds almost like the Absolute Fibonacci Technique that I use.
I believe that the "retrace bus" you mention is actually a stoploss run played by "the bad boys". Some people trigger entries as new highs are made and stops are moved to breakeven quickly; well, the bad boys push price down to trigger those stoplosses, shaking the small fishes out of the pond and re-buying in at a better price off them.
Ignored
You gotta love those "bad boys"!:
How do you keep from becoming ROADKILL under the wheels of the bus, WTB?
Anyone else?
An important question for a newbie like me if I
want to be around for awhile!
|
Joined Feb 2007
|
Status: Silly broker, pips are for kids
|455 Posts
well buddy, no offense taken.
but please allow me to clarify what I am trying to do:
I completely understand there is no method of trading that will never fail, there never was and there never will be. What I am trying to do is just lay down a set of rules to trade by. But these rules will be tested so that when we push that button and pull the trigger there is no doubt in our mind that even if this one is a loser, and the trade after that is a loser the rules that I trade by will produce plenty of profits soon enough to counter those losses.. That is the beginners trap, as they call it. A new trader will find a system trade is once and it doesnt work for them so they go onto the next system and the process repeats itself day in and day out until all their money is gone... Now, I do not believe in demo trading for there is no emoition in it.. You can make a million dollars trading in a demo account and lose all your money when it comes to be showtime. For example, I would not define myself as a successful trader, but I am trading in the "cnbc millionaire portfolio challenge" which is a trading competition using an account with fake money. I am in the top 17% out of a good 500,000 traders competing, but when it comes down to trading forex my losses and wins play tug-o-war I think the best thing to do is just go back on the charts, follow your rules and see if, from that designated period up until the present.. would it.. or would it not provide you with profits... I hope this makes sense.. I am at work and typing this so im a little distracted
Please don't take this the wrong way, but I know these questions all too well. These are gigantic signs of a) being afraid to lose (more money) and b) not trusting anything until somone hands you a signed written form saying "this will never fail".
Truth is - you're not trying to outguess and perfect every trade. A truckload of trades WILL FAIL. If you trade some entries like retraces or trendline touches aggressively, you WILL have to "just throw money on" at those points if that's your style. If you use PA and candlesticks, you WILL have to simply trust that people didn't invent these for nothing and lastly, but most importantly, you have to actually start trading them day in day out AS THEY OCCUR instead of wondering at each setup "will this one work? is this the perfect setup? is this sure to go or not? am i getting in too early? am i getting in too late?"
-> This is what demo is for - you learn to press the button in real time BUT you are allowed to make mistakes and actually review them. It is most important however to a) be honest to yourself about it and b) actually trade like it were REAL money and not just "meh, just demo anyway".
The answers to ALL these questions come from one thing - experience of actual live trading. People can TELL you everything, and you will still not trust any of it until you have actually done it dozens of times yourself first.
Failed trades and losses are part of the game. The whole "trick" is learning to accept that and move on. Over-thinking the theoretical part and trying to perfect everything into "no loss"-dom will never ever work and is just mentally crippling. I've gone through that phase, I am not just slinging words here...
Like I said, no offense intended. (also attaching an example of a low timeframe, temporary trendline which obeyed the "enter on the 'first' = third touch" rule to illustrate what I meant by that)
please help by posting here or sending me a PM, I can't seem to find this post mentioned above or the other references by Jacko
tx
Ignored
The link doesn't work (you knew that )
But to find Jacko's posts go to his post on this thread
and click on his name. From there you can go to all
of his posts. A great way to follow the expertise of many
of the traders on this wonderful forum.
Try Orange Roshan, too! Just search his name then view all posts.
Try it with anyone who's posts really makes great sense to YOU.
I personally like to pay as much attention to horizontal levels of support/resistance as to trendlines, specially to candlestick formations occurring at those levels. In fact, I reckon there are better ways to determine trends than the actual trendline.
Example: current chart of EURJPY below
Ignored
WTB, it seems like the SR lines you posted aren't good examples of SR lines... isn't a good SR line supposed to be actually tested? Your lines have one candle wick touch them, and then they're broken through. Or am I missing something?
After losing big on a few trades today, I've decided that while I will still do occasional trades on a 4-hr chart, I'm converting to a daily kind of guy. First of all, while I'm not that well capitalized (I've got a few K), I've got enough to set my stops large enough that I won't get stopped out by spikes. I'm going to use an indicator for confirmation, but I am going to try to use trending as much as possible. I'd rather live my life than sit at my computer looking at it every hour (or less time) during the day (or even every 4 hours . Has anyone else had this type of "I'm tired of it" switch...?
For mid-to-long-term trend trading (say, a week to month timeframe based on daily charts), how big are typical stop losses set to? Should I just follow a typical RR ratio of 3:1 or similar?
It seems that to give room for things like news releases, my SL needs to be at least 100-150 pips for a mid-term trade... isn't that really the only way to protect myself against spikes?
WTB, it seems like the SR lines you posted aren't good examples of SR lines... isn't a good SR line supposed to be actually tested? Your lines have one candle wick touch them, and then they're broken through. Or am I missing something?
Ignored
I am sure you have heard the trading principle "former resistance turned into support". See in my chart how those lines acted previously as swing tops and later on they held the retracement and thus acted as swing bottoms?
For example, have a look at what happened today friday early morning on EURUSD around 1.3500 and now look at what happened yesterday at that precise level. Yesterday 1.3500 acted as swing top, then we broke it during Tokyo session and retested prior London open. There's a confluence of horizontal support there (previous swing top + round number + weekly R2 pivot). Having proofed that level strong enough to hold the retrace, it has confirmed the up-bias for the first half of London session pushing EURUSD to 1.3540 (current market price as I type these lines).
After losing big on a few trades today, I've decided that while I will still do occasional trades on a 4-hr chart, I'm converting to a daily kind of guy. First of all, while I'm not that well capitalized (I've got a few K), I've got enough to set my stops large enough that I won't get stopped out by spikes. I'm going to use an indicator for confirmation, but I am going to try to use trending as much as possible. I'd rather live my life than sit at my computer looking at it every hour (or less time) during the day (or even every 4 hours . Has anyone else had this type of "I'm tired of it" switch...?
Ignored
I do lol ... I used to like scalping but now i check my charts 15 mins a day and trade using daily candles.
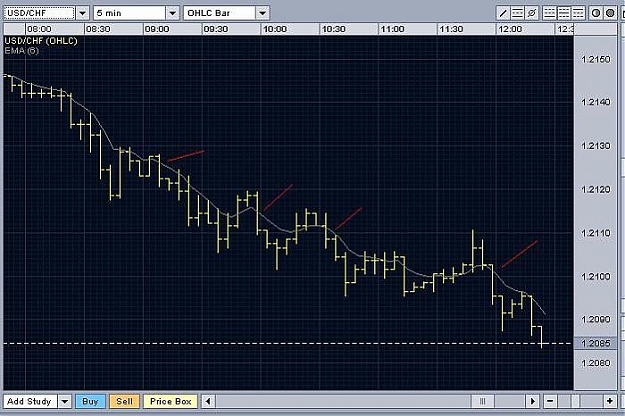
heres asimple way of entering a pullback/rally in the direction of the overall trend
in case of an downtrend....the price has to cross the 6 EMA from the downside, hold above the 6 EMA and the moment price is crossing the 6 EMA for the upside, this is a entry signal
of course, you need a strong trend to make it wortwhile
I am sure you have heard the trading principle "former resistance turned into support". See in my chart how those lines acted previously as swing tops and later on they held the retracement and thus acted as swing bottoms?
For example, have a look at what happened today friday early morning on EURUSD around 1.3500 and now look at what happened yesterday at that precise level. Yesterday 1.3500 acted as swing top, then we broke it during Tokyo session and retested prior London open. There's a confluence of horizontal support there (previous swing top + round number + weekly R2 pivot). Having proofed that level strong enough to hold the retrace, it has confirmed the up-bias for the first half of London session pushing EURUSD to 1.3540 (current market price as I type these lines).
Ignored
Thank you WTB, it makes perfect sense now... just had to go back and look at the chart!
For mid-to-long-term trend trading (say, a week to month timeframe based on daily charts), how big are typical stop losses set to? Should I just follow a typical RR ratio of 3:1 or similar?
It seems that to give room for things like news releases, my SL needs to be at least 100-150 pips for a mid-term trade... isn't that really the only way to protect myself against spikes?
Ignored
100-150 pips stop losses are typical for medium term trading in my opinion, can be as far as 200 pips although rare...
what i have shown is only a simple entry rule....if a rally/correction turns out to be a v-bottom, you will hopefully not get stoped into any position...if the correction turns out to be an a-b-c type of corrective move, usually you will get stoped out on the first attempt and have to make an second entry after the market has put in the c point
Here is an analogy my wife came up with.
You know those little fish that swim along side a whale or even the sharks?
Well, the whale or the shark is the market and we are the small fish swimming along the whale/shark. As long as we keep our eyes on it, stay close to it and go the same direction it is going, we are safe. However, when we get away from the whale/shark or start swimming in the opposite direction, the very thing that was protecting us and feeding us, suddenly is in a position to devour us.
Point is, we must stay close to the trend and go where ever it goes.
Stan
Here is an analogy my wife came up with.
You know those little fish that swim along side a whale or even the sharks?
Well, the whale or the shark is the market and we are the small fish swimming along the the whale/shark. As long as we keep our eyes on it, stay close to it and go the same direction it is going, we are safe. However, when we get away from the whale/shark or start swimming in the opposite direction, the very thing that was protecting us and feeding us, suddenly is in a position to devour us.
Point is, we must stay close to the trend and go where ever it goes.
Stan
Ignored
How about this analogy?
We are swimming in the river. As long as we go along with the stream we are safe and no need to push our energy, but when the time come we need to go against the stream, we need to put extra energy to swim. How much energy we can spend depend on how fit we are (or in margin sense, how strong is our margin)? We can’t against the stream every time because we’ll be exhausted and could be drown and die (or in margin sense, we are margin call, and our position close automatically).
|
Joined Feb 2007
|
Status: Small is beautifull
|1,368 Posts
caviar is expensive, no? (caviar is salmon's egg right?)
so that the one who can go against the market will have the great one?
that if translated as carry trade will be fit more ......
We are swimming in the river. As long as we go along with the stream we are safe and no need to push our energy, but when the time come we need to go against the stream, we need to put extra energy to swim. How much energy we can spend depend on how fit we are (or in margin sense, how strong is our margin)? We can’t against the stream every time because we’ll be exhausted and could be drown and die (or in margin sense, we are margin call, and our position close automatically).