I think I may found the holy grail and it's the simplest I've ever imagine, just follow the trend on high timeframes until it ends. That's all.
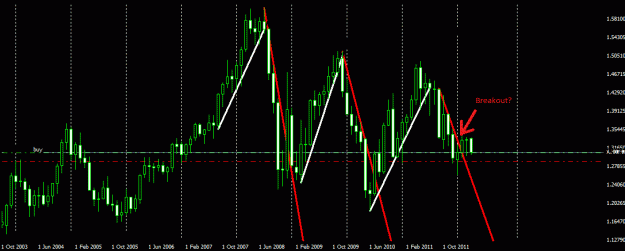
Let me explain my thoughts: a week ago I thinked that forex was a completely random market, but a few fellow traders from here show me the truth: if a market has trend, it is not random, and introduce myself to the famous Turtles System, after reading the book The complete turtletrader I learn that trend only exists in high timeframes, below that there is too much volatility and it's hard to predict the price movements, and that it's impossible to predict when the trend ends, so you have to follow it till it ends in the next breakout.
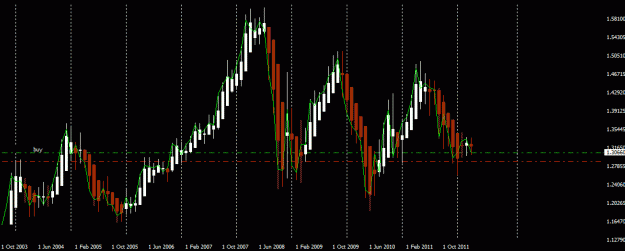
And the best indicator I've found to show the trend and its breakouts is Heiken Ashi, so the rules of this system are:
- When the last monthly bar is white, close your sell position and enter long.
- When the last monthly bar is red, close your buy position and enter short.
- Use 400 pips of SL.
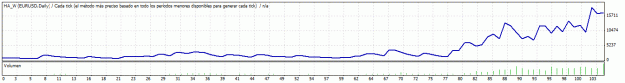
I've written a rudimentary EA based on this method (I've restricted the calculations to the first minute of the first 7 days of each month to optimize the backtest, you can delete this, the results are the same, but it takes almost 10 times more time), you can download it here for free, here are the results for a backtest from the past 10 years, from 2002/01/01 untill 2012/01/01:
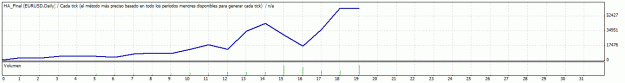
It turns 1000$ into 61000$!!! Including a drop in performance during 2009 when the balance falls from 44000 to 17000 during the high volatility of that year, and it recovers itself after!
I would appreciate so much your comments and critics to this method.
Let me explain my thoughts: a week ago I thinked that forex was a completely random market, but a few fellow traders from here show me the truth: if a market has trend, it is not random, and introduce myself to the famous Turtles System, after reading the book The complete turtletrader I learn that trend only exists in high timeframes, below that there is too much volatility and it's hard to predict the price movements, and that it's impossible to predict when the trend ends, so you have to follow it till it ends in the next breakout.
And the best indicator I've found to show the trend and its breakouts is Heiken Ashi, so the rules of this system are:
- When the last monthly bar is white, close your sell position and enter long.
- When the last monthly bar is red, close your buy position and enter short.
- Use 400 pips of SL.
Attached Image (click to enlarge)
I've written a rudimentary EA based on this method (I've restricted the calculations to the first minute of the first 7 days of each month to optimize the backtest, you can delete this, the results are the same, but it takes almost 10 times more time), you can download it here for free, here are the results for a backtest from the past 10 years, from 2002/01/01 untill 2012/01/01:
Attached Image (click to enlarge)
It turns 1000$ into 61000$!!! Including a drop in performance during 2009 when the balance falls from 44000 to 17000 during the high volatility of that year, and it recovers itself after!
I would appreciate so much your comments and critics to this method.
Attached File(s)