DislikedHere's a question: What is your biggest hurdle? If you don't mind sharing, I bet there's a great lesson in it for your fellow traders.Ignored
I've been lurking here at your excellent thread for a long time now soaking up all this great information so I thought it was time I joined in.
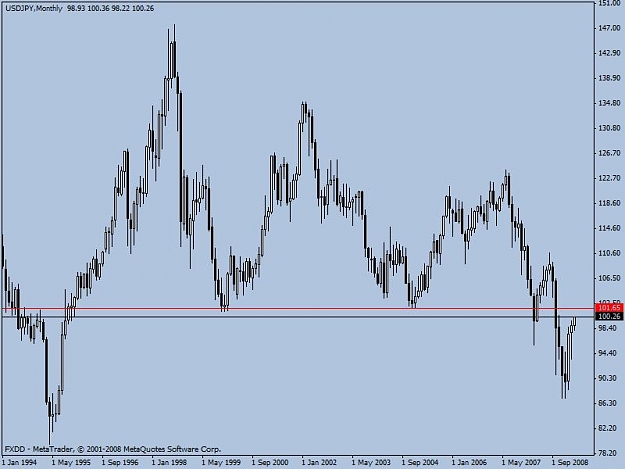
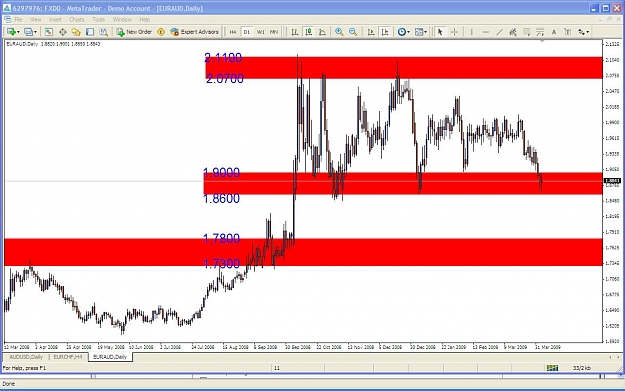
In response to your quesiton; my biggest hurdle, at the moment is (one I imagine a lot of traders share) entering my next trade after some really good action. For example, you were recently involved in a big EUR/JPY short - I was too. I was also shorting EUR/USD and GBP/USD at the same time. Between them I gathered close to a thousand pips. Obviously I was very pleased with that!! However, then comes the psych games - do I enter now or am I about to give back everything I just made!?!
Regards,
Dan