You know I was wondering for a few weeks now how i could be so wrong time after time when doing really short scalps of the 5min or 1min chart.
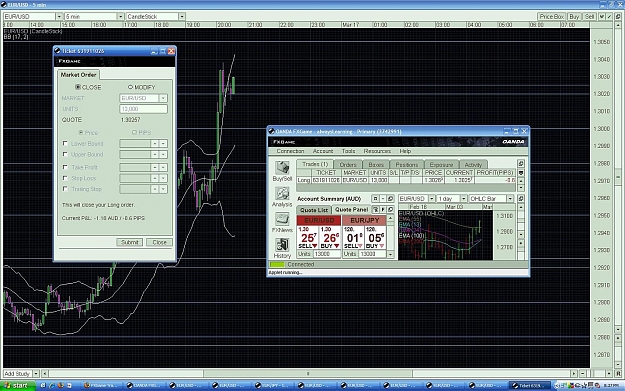
Not sure why I didn't notice it but as you can see from the picture below the actual quote that i would buy or sell at is different to the quote in the actual chart.
I asked the broker about this and the discrepency is due to the fact that with candle sticks it is kind of like an average over the 5minute intervel or whatever time frame you are looking at. If i switched to the 'min/max' view then it would be accurate or if i switched it to the 'bid' or 'ask' it also would be accurate.
Anyway I'm not saying that charts are no good or anything like that. In fact i think that charts are critical and all important. I'm just highlighting an error i made and something i didn't realise despite trading on various time frames for months now.
So, in a way candle sticks too are a kind of lagging indicator--even when you are looking at the close of the current candle.
Attached Image (click to enlarge)