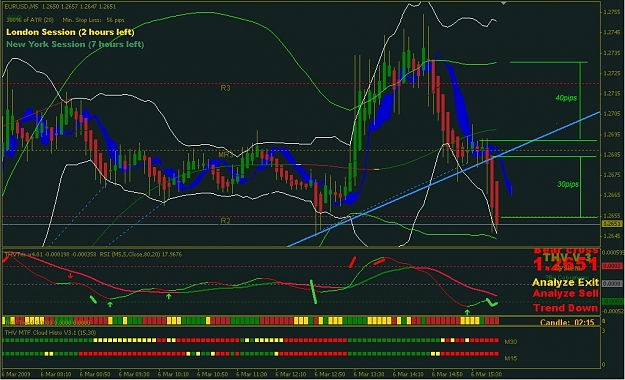
What shall I do more if for example I can see on my H1 timeframe:
- Heiken Ashi green candle is closing over the Coral indicator
- The price is above the blue cloud
- The Fast/Slow Trix are green
- The fast Trix is above the 0 line and the slow Trix is crossing up that line too
Look on the eur/gbp pair on H1, should I go long ?