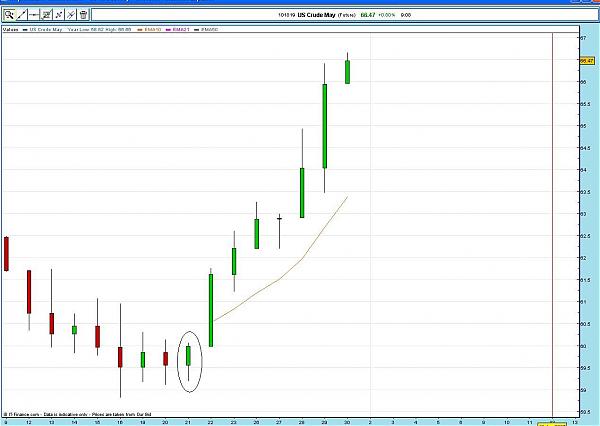
I plot fibs from every significant high and low from past to present see which ones are of interest and remove the rest.
Can repeat on lower time frames too.
Just see them as a way to understand price action
Can repeat on lower time frames too.
Just see them as a way to understand price action
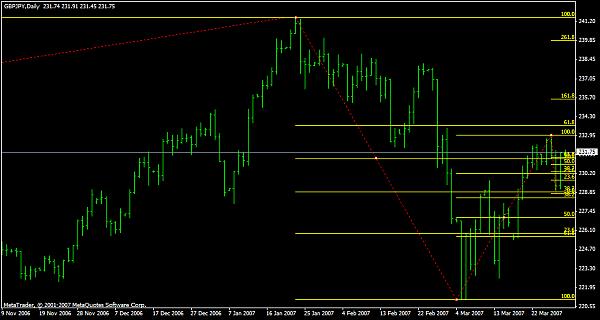
Attached Image
GOD IS NOT SHORT OF CASH