DislikedBuy back at 1.2768 (sell price 1.2766) for +40 profit. Im off out now
Todays results:
1st lot: +10, +10, +10 = +30
2nd lot: +10, 0, +40 = +50
Total +80 for 1 hours work woop woopIgnored
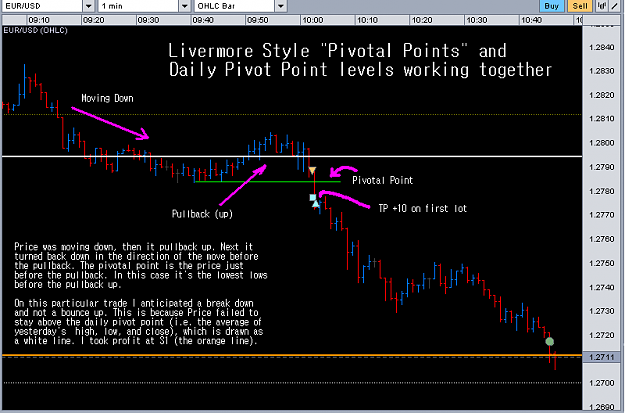
 Eur/Usd scalping inspired by Shakesfx
- #557
- Feb 25, 2009 10:39am Feb 25, 2009 10:39am
- Joined Sep 2006 | Status: Trader | 10,704 Posts
every Saint has a past. Every Sinner has a Future
- #560
- Feb 26, 2009 3:04pm Feb 26, 2009 3:04pm
- Joined Sep 2006 | Status: Trader | 10,704 Posts
every Saint has a past. Every Sinner has a Future