• Home
  • Forums
  • Trades
  • News
  • Calendar
  • Market
  • Brokers
  • Login
  • Join
  • User/Email: Password:
  • 8:09pm
Menu
  • Forums
  • Trades
  • News
  • Calendar
  • Market
  • Brokers
  • Login
  • Join
  • 8:09pm
Sister Sites
  • Metals Mine
  • Energy EXCH
  • Crypto Craft

Options

Bookmark Thread

First Page First Unread Last Page Last Post

Print Thread

Similar Threads

Parabolic SAR Expert Advisor 22 replies

Parabolic SAR on MT? 7 replies

Parabolic SAR (Stop and Reverse) ind 7 replies

Parabolic SAR 4 replies

Quick Question about parabolic SAR 1 reply

  • Trading Systems
  • /
  • Reply to Thread
  • Subscribe
  • 61
Attachments: Shakesfx GBP/ JPY Parabolic SAR. Nothing more, nothing less
Exit Attachments

Shakesfx GBP/ JPY Parabolic SAR. Nothing more, nothing less

  • Last Post
  •  
  • Page 1 2345 6
  • Page 1 234 6
  •  
  • Post #1
  • Quote
  • First Post: Edited Jan 4, 2009 8:53am Dec 26, 2008 7:59am | Edited Jan 4, 2009 8:53am
  •  shakesfx
  • | Membership Revoked | Joined Apr 2008 | 2,468 Posts
Shakesfx GBP/ JPY Parabolic SAR. Nothing more, nothing less.

EDIT: This system is for all pairs, not just GBP/JPY. (Unfortunately I cannot change the Thread title)

Having been burnt in the past by overtrading I sought a system that would offer a longer term profitable strategy. I settled on Parabolic SAR because it is simple and consistent. I have only back tested since ’04, but the results so far look promising. I know that all indictors lag, but SAR seems to be on the ball with not many negative trades. I have realised that most profitable traders in the 5% club mostly trade daily charts. Lets see how we get on with it, I am open to advice and will keep a journal of my trades here. I work in Iraq at present, so have limited access to internet, but will post as often as I can.
I stick to the DAILY charts and only trade in the direction of the WEEKLY SAR. I do not use any other indictors. This seems to take away all of the emotions during trading, and hopefully will allow me to carry on with normal life without being glued to screens everyday. I only need to check once a day, at the change of the daily candle to see if an opposite SAR signal has appeared. 5 mins a day for consistant profit suits me fine. Obviously, the profits shown here may not be to everyones taste, but I would rather have steady profit with less pips than fast profit (or loss). This trading style suits me and is what I am aiming for.


For the last 12 Months Dec 07- Dec 08, the following trades would have been placed using this daily system on GBY/JPY:

20/12/07 Sell at 226.16
24/01/08 Close Trade at 208.84 = +1732
06/02/08 Sell at 209.28
14/02/08 Close Trade at 212.42 = -314
29/02/08 Sell at 208.73
28/03/08 Close Trade at 199.73 = +900
18/04/08 Buy at 203.78
08/05/08 Close Trade at 204.60= +82
23/05/08 Buy at 205.97
01/07/08 Close Trade at 211.31= +540
18/07/08 Buy at 212.16
03/08/08 Close Trade at 212.64 = - 48
03/08/08 Sell at 212.64
22/09/08 Close Trade at 195.38 = +1726
30/09/08 Sell at 187.64
27/11/08 Close Trade at 146.59 = +4105
02/12/08 Sell at 138.55 Running g at 133.16 = +539 Pips on 25/12/08

Dec 07-Dec 08 total = + 9358 Pips (9 trades)

Out of those 9 trades, only 2 trades would have resulted in a negative return.
Back testing manually since Dec 2004 we have the following trades and results:

Dec 06 – Dec 07 = +3888 (14 trades)

28/11/06 Buy at 224.97
05/01/07 Close Trade at 230.81 = +584
12/01/07 Buy at 233.91
01/02/07 Close Trade at 236.98 = +307
28/02/07 Sell at 231.73
19/03/07 Close Trade at 225.97 = +576
19/03/07 Buy at 225.97
20/04/07 Close Trade at 237.36 = +1139
29/04/07 Buy at 238.18
13/05/07 Close Trade at 238.44 = +26
18/05/07 Buy at 239.43
08/06/07 Close Trade at 239.60 = +17
14/06/07 Buy at 241.74
27/06/08 Close Trade at 244.46 = +272
01/07/07 Buy at 247.28
26/07/07 Close Trade at 247.64 = +36
26/07/07 Sell at 247.64
08/08/07 Close Trade at 243.75 = +389
12/08/07 Sell at 238.93
23/08/07 Close Trade at 232.66 =+627
19/09/07 Sell at 232.85
28/09/07 Close Trade at 232.64 = -21
30/09/07 Buy at 234.77
17/10/07 Close Trade at 237.74 =+297
30/10/07 Buy at 236.38
11/11/07 Close Trade at 230.65 = -573
11/11/07 Sell at 230.65
29/11/07 Close Trade at 228.53 =+212


Dec 05 – Dec 06 = +238 (11 trades)

15/12/05 Sell at 208.36
13/01/06 Close Trade at 202.83 =+553
22/02/06 Buy at 207.22
27/02/06 Close Trade at 202.16 = -506
29/03/06 Buy at 205.57
21/04/06 Close Trade at 207.76 =+219
03/05/06 Buy at 208.63
10/05/06 Close Trade at 206.18 = -245
23/05/06 Buy at 210.04
21/06/06 Close Trade at 211.86 =+184
06/07/06 Buy at 212.18
10/07/06 Close Trade at 210.40 = -178
14/07/06 Buy at 212.71
28/07/06 Close Trade at 213.63 = +92
04/08/06 Buy at 217.00
18/08.06 Close Trade at 217.82 =+82
24/08/06 Buy at 220.27
05/09/06 Close Trade at 221.30 =+103
15/09/06 Buy at 221.70
16/10/06 Close Trade at 221.63 = -7
23/10/06 Buy at 223.53
14/11/06 Close Trade at 222.94 = -59


Dec 04 – Dec 05 = +2155 (7 trades)

01/12/04 Buy at 196.72
21/12/04 Close Trade at 201.28 = +456
30/03/05 Buy at 201.61
21/04/05 Close Trade at 205.23 =+362
17/05/05 Sell at 196.54
13/06/05 Close Trade at 196.82 =+ 28
01/07/05 Sell at 197.59
27/07/05 Close Trade at 195.46 =+ 213
30/08/05 Buy at 198.68
12/09/05 Close Trade at 200.71 =+ 203
05/10/05 Buy at 201.04
07/11/05 Close Trade at 206.57 =+553
28/11/05 Buy at 204.93
14/12/05 Close Trade at 208.33 =+340

Back testing shows mostly positive trades. In fact out of a total of 41 trades since Dec ’04, only 9 trades were closed at a loss. Largest drawdown was 573 pips during Nov ’07. Large drawdown’s such as this would obviously be protected by a SL. I am back testing manually using new parameters to see which TP and SL levels work best for locking in profits. I will post the results using SL’s and TP levels as soon as I can.

RULES:

Parabolic SAR settings: (0.02,0.20)

Check the daily chart at the close/open of a new daily candle.

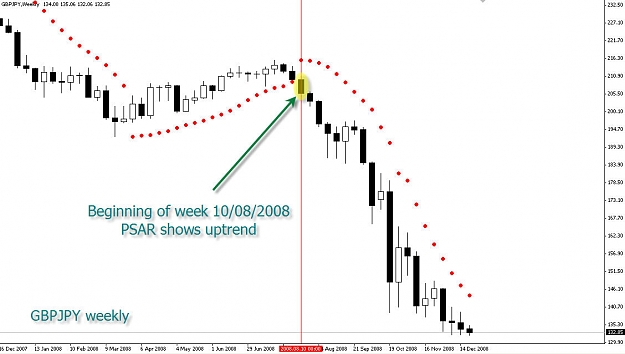
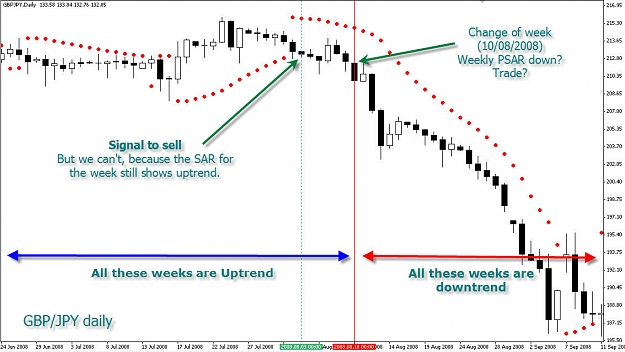
If an opposite SAR is shown, check against the weekly chart for overall trend.
If the weekly and daily SAR’s are in agreement, enter the trade immediately at new candle.

Check once a day at the open/close of the new daily candle and wait for a reversal SAR to appear.

If reversal SAR appears, DO NOT exit trade until completion of THAT daily candle, this is to ensure that this is a definite reversal signal as sometimes the SAR dot can repaint itself in the opposite direction. When this candle is complete and the next daily candle appears EXIT THE TRADE.

Await the next DAILY entry signal.

EDIT: This system has been refined, check pages 3, 4 and 5 for latest version using 4hr SAR entry with DAILY and WEEKLY SAR's.


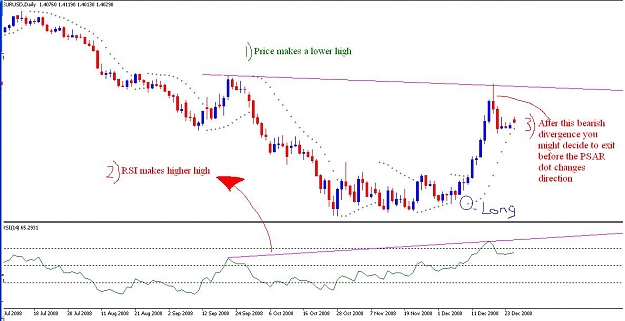
Examples for Long and Short entries:
Attached Images (click to enlarge)
Click to Enlarge

Name: gj weekly sar.gif
Size: 41 KB Click to Enlarge

Name: gj daily sar Short entry.gif
Size: 36 KB Click to Enlarge

Name: gj daily sar long entry.gif
Size: 35 KB
  • Post #2
  • Quote
  • Edited at 10:02am Dec 26, 2008 9:24am | Edited at 10:02am
  •  fontu
  • Joined Mar 2008 | Status: Name real with real own way | 16,423 Posts
Thanks shakesfx posting it here & inspiring me specially for the long term trades as I have also not much time to sit before the computer & when sitting doing much bad trades than goods. Well said " fast profit or loss " both very easily happen and like others gambling ultimately loss specially due gambling mind set up automatically develops trying for more trades & more profit .

Hope you continue your good works & all others will be benefitted too.
I will test on demo from next week for sure.
thanks
fontu
  • Post #3
  • Quote
  • Dec 26, 2008 10:22am Dec 26, 2008 10:22am
  •  botadufig05
  • | Joined Aug 2008 | Status: Member | 203 Posts
Will really like to follow this thread. I do love PSAR and GJ is my pair. Although most people say that PSAR do lag, but i love it. I have a special way of reading and it works very well for me, even on lower TFs.

Will look out for your post. Thanks Bro
  • Post #4
  • Quote
  • Dec 26, 2008 3:03pm Dec 26, 2008 3:03pm
  •  stopman
  • | Joined Jul 2008 | Status: Member | 36 Posts
I can't trade fulltime too, so I'm in!
  • Post #5
  • Quote
  • Dec 26, 2008 4:08pm Dec 26, 2008 4:08pm
  •  misterboy
  • | Joined Aug 2008 | Status: Member | 341 Posts
I also used to use a parabolic SAR system. Although I didn't lose, I knew I would at some point because I didnt use anything else except PSAR. Then I came across the AshFx system and I used it to make additions to my older version. I dont check teh weekly, but I think I will start doing that as it can avoid bad trades.

. One thing that could help would be to keep an eye on RSI divergence. RSI seems to be good for divergence. Just to make sure theres no divergence for the opposite direction when entering. And also to make sure there isn't a divergence in the opposite side when already in a trade. Warning sign to exit. I keep an eye on it as well. I noticed that divergence on daily can be really strong. Ad you still only have to check once a day when a new candle opens..
  • Post #6
  • Quote
  • Dec 26, 2008 5:23pm Dec 26, 2008 5:23pm
  •  shakesfx
  • | Membership Revoked | Joined Apr 2008 | 2,468 Posts
Money Management and Drawdown’s....

As you already know, most (trending) indicators work very well in Trending markets, but fall apart in ranging markets. PSAR as a lagging indicator is suspectable to this, but instead of account blowing, seems to produce minimal positive results during those times. I have picked the 2004 period when GBP/JPY was stuck in a range between 190 and 205 to see how PSAR preformed. As you can see, although the year ended in profit, it was minimal. Locking in profits is essential using PSAR, but which method to use needs back testing.

By using numerous lots, we could increase the yearly total considerably.


Firstly, Normal Results using 1 Lot size. I have not used a SL in these results as I wanted to see the raw data.


Dec 03 – Dec 04 using direction of WEEKLY PSAR ONLY.

10/12/03 Buy 188.90, TP 193.92 = +502
04/02/04 Buy 193.94, TP 203.64 = +970
06/03/04 Buy 207.16, SL 200.64 = -652
11/03/04 Sell 199.95, TP 194.86 = +509
26/04/04 Sell 193.90, SL 196.97 = -307
03/06/04 Buy 201.63, TP 201.63 = 000
05/07/04 Buy 198.51, TP 200.83 = +232
29/07/04 Buy 203.79, SL 200.75 = -304
18/08/04 Sell 200.75, TP 196.90 =+385
16/11/04 Sell 194.56, TP 194.93 =-37

Total = 1298


As we can see; a year’s trading with reference to the Weekly PSAR for trend direction produces fewer negative trades in a ranging market. Downside is the large drawdown sometimes required during the trade. You can see the - 652 pips in March 04 is something we need to avoid.
I have decided to trade with the following, in order to maximise profits and reduce losses. 1 lot is a position size for reference, not 1 actual forex “Lot”


3 lots.

SL’s set at -200 Pips.

1st Lot TP at 100 Pips.

2nd At +100 pips, SL moved to B/E, when at 200 pips, then SL moved to lock in 100 pips, allowed to run until reversal PSAR signal.

3rd At +100 pips, SL moved to B/E, when at 200 pips, then SL moved to lock in 100 pips, allowed to run until reversal PSAR signal.


Back testing during the Dec 03 – Dec 04 period shown above would have now produced the following results (previous single position size in RED, using 3 equal position sizes in Blue):-


10/12/03 Buy 188.90 TP 193.92 = +512
1st Lot TP at +100, 2nd Lot TP at +512, 3rd Lots TP at +512 pips. (100+512+512=1124)
04/02/04 Buy 193.94, TP 203.64 = +970
1st Lot TP at +100, 2nd Lot TP at +970, 3rd Lot TP at +970 Pips. (100+970+970=2040)
06/03/04 Buy 207.16, SL 200.64 = -652
1st Lot TP at +100, 2nd Lot SL at B/E, 3rd Lot SL at B/E (+100)
11/03/04 Sell 199.95, TP 194.86 = +509
1st Lot TP at +100, 2nd Lot at B/E, 3rd Lot at B/E (+100)
26/04/04 Sell 193.90, SL 196.97 = -307
1st Lot -200, 2nd Lot -200, 3rd Lot -200 (-600)
03/06/04 Buy 201.63, TP 201.63 = 000
1st Lot TP +100, 2nd Lot TP at +100, 3rd Lot TP at +100 (+300)
05/07/04 Buy 198.51, TP 200.83 = +232
1st Lot TP +100, 2nd Lot TP at +100, 3rd Lot TP at +100 (+300)
29/07/04 Buy 203.79, SL 200.75 = -304
1st Lot TP +100, 2nd Lot TP at +100, 3rd Lot TP at +100 (+300)
18/08/04 Sell 200.75, TP 196.90 =+385
1st Lot TP +100, 2nd Lot TP at +385, 3rd Lot TP at +385 (+1840)
16/11/04 Sell 194.56, TP 194.93 =-37
1st Lot TP +100, 2nd Lot TP at B/E, 3rd Lot at B/E (+100)


Previous Total = 1298

New total using 3 position sizes = 4634 (or divided by 3 positions = average 1544.67 pips per position)

Now, using 3 lots has reduced our Stop Loss to -200 pips and has prevented the large drawdown associated before due to taking profits when they are on the table . BUT of course 3 lots is 3 x times the risk and 3 x -200 pips!

I have decided to divide same 1 lot total risk (my own risk is 4% of account) into 3 lots.

Hypothetically I refer to a “Lot” as just an amount, not a specific size. This is totally up to the individual.

3 Lots at 4%, say a hypothetical $20 000 account at = 4% / 3 = 1.33% per position= $266.66 risk per trade per Lot (-200 pips SL: $1.33 x 200= $266.66)
Yearly total = $1.33 x 1st Lot totals (+700 pips) = $931
Yearly total = $1.33 x 2nd Lot totals (+1967 pips) = $2616.11
Yearly total = $1.33 x 3rd Lot totals (+1967 pips) = $2616.11

Yearly total using 3 lots/positions = $6163.22

Using 1 Lot Scenario:

1 Lot at 4%, say $20 000 account at 4% =$800 risk per trade as above,
-200 pips SL = $4 per pip.
$4 x 1298 (based on only 1 lot used total pips from above) = $5192.

Yearly total using 1 single Lot = $5192

A difference of $971.22 excess profit if using 3 Lots. A total risk of 4% per trade. You would need 25 losing trades in a row to blow your account.

This was a bad year for the system (2004), but yielded a 25% return on the account using 4% risk.

If we compound and work forward from 2003 this is where we would be using just the 1 lot size with a $20000 account.

2004 1298 Pips x $4 = 5192 + 20 000 = $25192

2005 2155 Pips x ($25192/4%=$1007.68/200(SL)= $5.03 x 2155 pips =10857 + 25 192 = $36049

2006 238 Pips x ($36049/4%=$1441.96/200(SL)= $7.20 x 238 pips = 1716 + 36049 = $37764

2007 3888 Pips x ($37764/4%=$1510.60/200(SL)=$7.55 x 3888 pips=29366+37764 = $67130

2008 9358 Pips x ($67130/4%=$2685.20/200(SL)=$13.43x 9358 pips=125640+67130 =$192770

I have not had time yet to chart the difference between using 1 lot and 3 lots during 2005/6/7/8 but I’m sure it would have eliminated some of the negative trades. I will post these in due course. The above figures just using one position size are impressive to say the least for only an average of 10-14 trades per year.
Attached Image (click to enlarge)
Click to Enlarge

Name: gj daily sar range bound 2004.gif
Size: 38 KB
  • Post #7
  • Quote
  • Dec 26, 2008 5:35pm Dec 26, 2008 5:35pm
  •  shakesfx
  • | Membership Revoked | Joined Apr 2008 | 2,468 Posts
Quoting fontu
Disliked
Thanks shakesfx posting it here & inspiring me specially for the long term trades as I have also not much time to sit before the computer & when sitting doing much bad trades than goods. Well said " fast profit or loss " both very easily happen and like others gambling ultimately loss specially due gambling mind set up automatically develops trying for more trades & more profit .

Hope you continue your good works & all others will be benefitted too.
I will test on demo from next week for sure.
thanks
fontu
Ignored
Hello fontu,

I totally agree with you. Fast profit turns into fast loss due to using lower timeframes. When we lose we feel the need to take revenge on the market to recover our loses, but of course we end up over trading and losing even more. Patience is the key. Let us know how you get on with the demo. Cheers Bro
  • Post #8
  • Quote
  • Dec 26, 2008 5:39pm Dec 26, 2008 5:39pm
  •  shakesfx
  • | Membership Revoked | Joined Apr 2008 | 2,468 Posts
Quoting botadufig05
Disliked
Will really like to follow this thread. I do love PSAR and GJ is my pair. Although most people say that PSAR do lag, but i love it. I have a special way of reading and it works very well for me, even on lower TFs.

Will look out for your post. Thanks Bro
Ignored
Hello and thanks botadufig,

Im glad it's working well for you. What is your special way of reading PSAR? You're more than welcome to share your style with us here. Cheers bro
  • Post #9
  • Quote
  • Dec 26, 2008 5:42pm Dec 26, 2008 5:42pm
  •  LazyPip
  • | Joined Jun 2007 | Status: I'm not lazy, the pips are | 105 Posts
Yes, I've actually noticed the same thing regarding longer timeframe trading, most methods have a greater edge compared to the scalping-lower-timeframe ones (if one can hold still in front of occasional big drawdowns).

This is definitely something. Great finds. Thank you for kindly posting the results of your analysis.

One thing I'd like to ask though. I've been also analysing/comparing the trades you posted and one fact is that while the PSAR itself does not have much variantion between brokers, the actual open price of the daily candle has a considerable influence in the trade entries/exits. So, mind if I ask which broker feed you are using?

Thanks in advance!
  • Post #10
  • Quote
  • Dec 26, 2008 5:42pm Dec 26, 2008 5:42pm
  •  shakesfx
  • | Membership Revoked | Joined Apr 2008 | 2,468 Posts
Quoting stopman
Disliked
I can't trade fulltime too, so I'm in!
Ignored
Welcome and Good to see you Stopman, hopefully we can all learn more as the thread grows. Cheers bro
  • Post #11
  • Quote
  • Dec 26, 2008 5:47pm Dec 26, 2008 5:47pm
  •  shakesfx
  • | Membership Revoked | Joined Apr 2008 | 2,468 Posts
Quoting misterboy
Disliked
I also used to use a parabolic SAR system. Although I didn't lose, I knew I would at some point because I didnt use anything else except PSAR. Then I came across the AshFx system and I used it to make additions to my older version. I dont check teh weekly, but I think I will start doing that as it can avoid bad trades.

. One thing that could help would be to keep an eye on RSI divergence. RSI seems to be good for divergence. Just to make sure theres no divergence for the opposite direction when entering. And also to make sure there isn't a divergence...
Ignored
Hello and welcome misterboy,

Thanks for your advice bro, thats what this forum is all about, helping each other. If you could post a chart so others could see what you mean with the RSI and PSAR it (I'm sure) would be appreciated by many. Cheers
  • Post #12
  • Quote
  • Dec 26, 2008 5:56pm Dec 26, 2008 5:56pm
  •  capetown
  • | Commercial Member | Joined Dec 2007 | 1,089 Posts
Nice system I just looked at GU on my chart and it looks nice. I will look at this thread. Thanks for sharing.
  • Post #13
  • Quote
  • Dec 26, 2008 6:24pm Dec 26, 2008 6:24pm
  •  shakesfx
  • | Membership Revoked | Joined Apr 2008 | 2,468 Posts
Quoting LazyPip
Disliked
Yes, I've actually noticed the same thing regarding longer timeframe trading, most methods have a greater edge compared to the scalping-lower-timeframe ones (if one can hold still in front of occasional big drawdowns).

This is definitely something. Great finds. Thank you for kindly posting the results of your analysis.

One thing I'd like to ask though. I've been also analysing/comparing the trades you posted and one fact is that while the PSAR itself does not have much variantion between brokers, the actual open price of the daily candle has...
Ignored
Hello Lazy pip and welcome to the thread. I'm using ODL data feed, not brilliant for smaller timeframes, but seems OK on daily. I use a different broker to place trades on a different platform. Maybe we have candles stepping at different time zones?
  • Post #14
  • Quote
  • Dec 26, 2008 6:44pm Dec 26, 2008 6:44pm
  •  misterboy
  • | Joined Aug 2008 | Status: Member | 341 Posts
Quoting shakesfx
Disliked
Hello and welcome misterboy,

Thanks for your advice bro, thats what this forum is all about, helping each other. If you could post a chart so others could see what you mean with the RSI and PSAR it (I'm sure) would be appreciated by many. Cheers
Ignored
Sure. I'm not sure if I missed something or not so, I am going to assume you use PSAR to exit as well. Here, I am going to post a very recent example of EUR/USD where there was RSI divergence but PSAR had not given us a signal to exit the long....Seeing tihs divergence, it would help protecting some profit rather than seeing some of it disappear by the time the opposite PSAR dot appears.
Attached Image (click to enlarge)
Click to Enlarge

Name: divergence.JPG
Size: 86 KB
  • Post #15
  • Quote
  • Dec 27, 2008 7:48pm Dec 27, 2008 7:48pm
  •  LazyPip
  • | Joined Jun 2007 | Status: I'm not lazy, the pips are | 105 Posts
Quoting shakesfx
Disliked
Hello Lazy pip and welcome to the thread. I'm using ODL data feed, not brilliant for smaller timeframes, but seems OK on daily. I use a different broker to place trades on a different platform. Maybe we have candles stepping at different time zones?
Ignored
Yes, it seems so, or perhaps it's the sunday candles which open a few hours earlier/later. I am using the InterbankFX demo platform for testing (also not the broker I use), and it's GMT time, opening sunday candles at 23:00 GMT. I intend to test in this platform to see if I get the same results or maybe slightly better/worse. I've downloaded ODL to compare as well.

---

One other question, how do you deal with entries on trades on the daily chart which are formed before the weekly PSAR is shown? i.e. before the weekly candle is closed. The PSAR may repaint during the week.

Example:

(first chart) WEEKLY CHART
Week of 10 August (10/08/2008).
During the previous week, the PSAR showed an uptrend. The next week of 10 August showed an opposite PSAR indicating downtrend.

(second chart) DAILY CHART
If we jump to the daily chart, we see that the PSAR already indicated a downtrend on the 1st of August with a confirmation for entry on 3 August. However, we could not take this trade, because we were still in the week before 10 August, which showed an uptrend in the weekly time frame.

So what do we do?
Do we wait to open the trade on the 10th or 11th of August (the start of the new downtrend PSAR week)?

Alternatively, we might have not ended up taking this trade either way. This is because for all we know the PSAR on the beginning of the week of 10 August could be still be showing an uptrend on the weekly chart. It might have repainted later in the week when the price fell lower.

This makes it a little hard to backtest using only past data shown in MetaTrader.

Does it make sense?

Thanks again in advance.
Attached Images (click to enlarge)
Click to Enlarge

Name: -001.jpg
Size: 77 KB Click to Enlarge

Name: -002.jpg
Size: 111 KB
  • Post #16
  • Quote
  • Dec 28, 2008 1:08pm Dec 28, 2008 1:08pm
  •  botadufig05
  • | Joined Aug 2008 | Status: Member | 203 Posts
Quoting shakesfx
Disliked
Hello and thanks botadufig,

Im glad it's working well for you. What is your special way of reading PSAR? You're more than welcome to share your style with us here. Cheers bro
Ignored
It is actually a kind of observation. I use stochastic slow as well, so anytime stoch is turning up on any timeframe and PSAR is still far away from price, then it tells me we are still likely to go down more or price will rather range than go up.

I don't know if i am making sense. It is actually a personal thing, which most times i find difficult to explain. After watching a particular indicator for some time, one start seeing a kind of repetitive actions.

However, I am a Sis
  • Post #17
  • Quote
  • Edited at 8:37am Dec 29, 2008 8:25am | Edited at 8:37am
  •  fontu
  • Joined Mar 2008 | Status: Name real with real own way | 16,423 Posts
AS both weekly & daily candle & par sar were down I took 3 lots of 1 in gj in the morning today with sl 300 , now I see over 100 pips movements & so sl down to 100 to reduce risks.with the movements I will secure the profit first & will let them run.I use other indicators just to see changes but not taking trades.

fontu.
Attached Image
  • Post #18
  • Quote
  • Dec 29, 2008 11:07am Dec 29, 2008 11:07am
  •  fontu
  • Joined Mar 2008 | Status: Name real with real own way | 16,423 Posts
check another time to see profit 165 pips each , so sl shift to secure profit & let them run & check once a day .

fontu
  • Post #19
  • Quote
  • Dec 29, 2008 11:56am Dec 29, 2008 11:56am
  •  vladv
  • | Joined Mar 2006 | Status: Mr. | 203 Posts
Quoting botadufig05
Disliked
Will really like to follow this thread. I do love PSAR and GJ is my pair. Although most people say that PSAR do lag, but i love it. I have a special way of reading and it works very well for me, even on lower TFs.
Will look out for your post. Thanks Bro
Ignored

Can you share with us in what way to YOU use the pSAR?What pairs and timeframe do you use for better results?Thanks a lot.
  • Post #20
  • Quote
  • Dec 29, 2008 1:53pm Dec 29, 2008 1:53pm
  •  fontu
  • Joined Mar 2008 | Status: Name real with real own way | 16,423 Posts
Just before going to bed recheck again , 260 pips each , sl down another 100.good enough , no tension ,no sitting ,nothing .Thinking close one ,take partial profit from another & set tp to the rest & 1 free to go.

fontu
  • Trading Systems
  • /
  • Shakesfx GBP/ JPY Parabolic SAR. Nothing more, nothing less
  • Reply to Thread
    • Page 1 2345 6
    • Page 1 234 6
0 traders viewing now
  • More
Top of Page
  • Facebook
  • Twitter
About FF
  • Mission
  • Products
  • User Guide
  • Media Kit
  • Blog
  • Contact
FF Products
  • Forums
  • Trades
  • Calendar
  • News
  • Market
  • Brokers
  • Trade Explorer
FF Website
  • Homepage
  • Search
  • Members
  • Report a Bug
Follow FF
  • Facebook
  • Twitter

FF Sister Sites:

  • Metals Mine
  • Energy EXCH
  • Crypto Craft

Forex Factory® is a brand of Fair Economy, Inc.

Terms of Service / ©2021