Mike W,
What does the small writing say on your Avatar?
Potential...
Josh
Ignored
Hey Josh, it says "not everyone gets to be an astronaut when they grow up". haha I think they are pretty funny. I got it from a site called www.despair.com. They sell the demotivators in different formats, but you can find them anywhere on the net.
(That's not a promo, I was just answering the question. Besides I think they are highly overpriced when you could just make the stuff yourself for free if you have a good printer).
Ignored
LOL they sell the demotivators ? Thats madness . . .
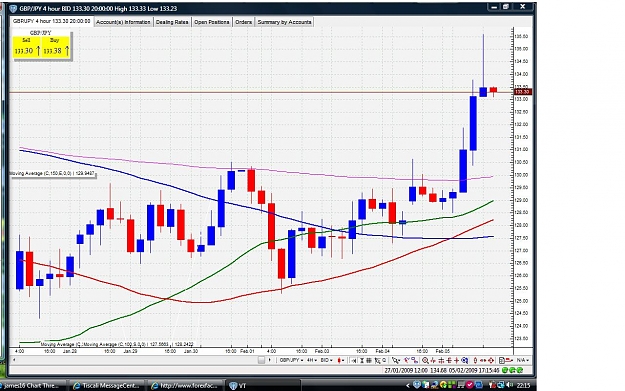
After the break higher of 125 this buob off the 125 round number is a retest of that area.
we then moved up to 130 back again with another pin off 125. it happens alot at the round numbers.
now we have broken convincingly the 130, look for a retest. & repeat..
I got few questions to ask. Basically this kind of situation confused me a lot.
Before that, the chart that I show is 4H charts but I look at daily and then find PA on daily PPZ. Don't look below H4.
Chart #1 (NZDUSD)
What do you guys think about the BUOB? If it breaks, would you guys take it as there is congestion areas marked with blue.
Chart #2 (USDCHF)
The trade I'm currently in. Entered on BUOB on H4. Any comments about the pros and cons of this trade. I noticed the round number 1.800 (daily PPZ), my first target.
Chart #3 (CADCHF)
PB on H4, off daily PPZ. Though the size is small but I think the location is good. Triple top, divergence, off daily PPZ. Any pros and cons?
Thanks. Sorry for too much question in 1 post. Just been able to look charts now.
p.s: sorry for the bad english lol in hurry to recheck.
After the break higher of 125 this buob off the 125 round number is a retest of that area.
we then moved up to 130 back again with another pin off 125. it happens alot at the round numbers.
now we have broken convincingly the 130, look for a retest. & repeat..
Can you tell me if the chart in post 20627 looks like a good setup?
Ignored
Hey Bertie
While I don't have a pin on my chart here is my analysis
Gbp overall made big moves across the board today. So that pin could be nothing more then the pause before the next move. What i mean is that pin to me is not in a strong enough place to warrant a trade on my own. One might take a pin like that back to the strong PPZ area which like gbp/jpy is under us and in this case at the 1.4500 area as depicted on my chart. So where do I see the best opportunity? Again down at the PPZ flip of 1.4500
while Mike has been on the gbp. here's another to keep an eye on.
gbpchf has broken the 169 level. how high it goes i dont know but 175 looks good.
I'll be looking for pa around the 169 area for a retest
I got few questions to ask. Basically this kind of situation confused me a lot.
Before that, the chart that I show is 4H charts but I look at daily and then find PA on daily PPZ. Don't look below H4.
Chart #1 (NZDUSD)
What do you guys think about the BUOB? If it breaks, would you guys take it as there is congestion areas marked with blue.
Yep You marked off exactly what the problem would be trading into that. Generally these bars are to be played at swing lows. This is a swing high and trading into tough area.
Chart #2 (USDCHF)
The trade I'm currently in. Entered on BUOB on H4. Any comments about the pros and cons of this trade. I noticed the round number 1.800 (daily PPZ), my first target.
Again careful here, you are trading a BUOB at a swing high. It feels like you are trying to force a trade a bit more. Check out the daily what you are now trading into. Also the better BUOB was at 1.15 on the 4hr. See the difference?
Chart #3 (CADCHF)
PB on H4, off daily PPZ. Though the size is small but I think the location is good. Triple top, divergence, off daily PPZ. Any pros and cons?
I wouldn't really even call this much of a pin. Like you said very small in size. Body and nose are about the same. Trading right into a lot of highs and support. I would be careful here. Not an A trade, wait for something better.
Thanks. Sorry for too much question in 1 post. Just been able to look charts now.
Again these are just my views
p.s: sorry for the bad english lol in hurry to recheck.
Thanks Mike. Appreciate that. BUOB - Swing low and vice versa, now I see the difference. Just another follow-up Q about the NZDUSD. Like in the chart, directly above the BUOB I marked is congestion area. So do you wait for price to break all those areas before looking for PA? Just want to know how you would look at those kind of areas, I mean your thought process (except leave it for later, then look it back).
Thanks Mike. Appreciate that. BUOB - Swing low and vice versa, now I see the difference. Just another follow-up Q about the NZDUSD. Like in the chart, directly above the BUOB I marked is congestion area. So do you wait for price to break all those areas before looking for PA? Just want to know how you would look at those kind of areas, I mean your thought process (except leave it for later, then look it back).
Ignored
Well you can approach nzd/usd from a few ways. At least from my perspective. With this type of area, if we see the previous support of that congestion turn into resistance(where we are now). You might look to use this FLIP(ppz), to play off. So instead of trading into it, you want to try to trade away from it. I think the chart explains it better
I would personally prefer to wait to see a retest of .5000 and create a double bottom, or watch this area. But you could trade off the middle area(blue box ppz).
Just thought I would show a few things you could look for. Chart looks messier then it is
The only pin I have on my dailys is chf/JPY...Take a look, I dont feel comfortable playing this bearish pin at a swing low against previous lows. Seems like it will not have room to run. Can anyone comment on this. I am going to stay away I think, nto sure at this swing low area.
That pretty girl keeping you busy. lol