• Home
  • Forums
  • Trades
  • News
  • Calendar
  • Market
  • Brokers
  • Login
  • Join
  • User/Email: Password:
  • 7:22am
Menu
  • Forums
  • Trades
  • News
  • Calendar
  • Market
  • Brokers
  • Login
  • Join
  • 7:22am
Sister Sites
  • Metals Mine
  • Energy EXCH
  • Crypto Craft

Options

Bookmark Thread

First Page First Unread Last Page Last Post

Print Thread

Similar Threads

4 Hour Strategy Macd+other Indicator 21 replies

average true range for 1 hour and 4 hour charts 2 replies

X-1102 1 hour , 4 hour and daily Tf trades 7 replies

Create a verticle line at certain hour for every certain hour 16 replies

Is the "4 Hour Strategy (MACD)" the best system here at FF? 20 replies

  • Commercial Content
  • /
  • Reply to Thread
  • Subscribe
  • 12,931
Attachments: 4 Hour Strategy (MACD)
Exit Attachments
Tags: 4 Hour Strategy (MACD)
Cancel

4 Hour Strategy (MACD)

  • Last Post
  •  
  • 1 928929Page 930931932 1579
  • 1 Page 930 1579
  •  
  • Post #18,581
  • Quote
  • Jan 30, 2009 10:34am Jan 30, 2009 10:34am
  •  orangeRANGE
  • | Joined Dec 2008 | Status: revisit | 1,896 Posts
Quoting draven
Disliked
good for you orange. hope you managed to sell at TP. simply i cant do CT trades.

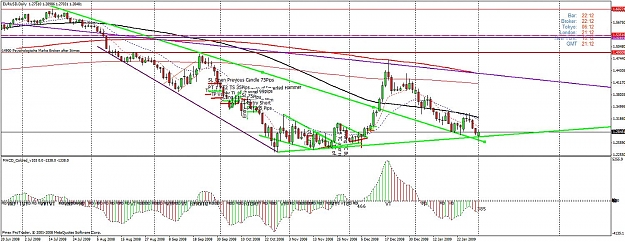
Turnarounds from trendline and 89 SMA(blue rectangles) were great setups also but huge candles. I couldnt use that RT and TC. has anybody got some pips or thoughts? maybe some 1h tricks for these setups?
I think i am not brave enough for this sytem.
Ignored
Thank you mate...I did bag 50pips just now as in my post earlier. Be brave dude...keep watching this thread on how me and the gang make our entry.

Have a good weekend.
 
 
  • Post #18,582
  • Quote
  • Jan 31, 2009 10:28pm Jan 31, 2009 10:28pm
  •  yuyudada
  • | Joined Jan 2009 | Status: yu yu | 73 Posts
"]good for you orange. hope you managed to sell at TP. simply i cant do CT trades."
==================================


could you please tell me what is TP and CT mean? i am a newcomer .thank you !
 
 
  • Post #18,583
  • Quote
  • Feb 1, 2009 4:33am Feb 1, 2009 4:33am
  •  orangeRANGE
  • | Joined Dec 2008 | Status: revisit | 1,896 Posts
Quoting yuyudada
Disliked
"]good for you orange. hope you managed to sell at TP. simply i cant do CT trades."
==================================


could you please tell me what is TP and CT mean? i am a newcomer .thank you !
Ignored
TP = take profit
CT = Counter Trend
 
 
  • Post #18,584
  • Quote
  • Feb 1, 2009 8:22pm Feb 1, 2009 8:22pm
  •  orangeRANGE
  • | Joined Dec 2008 | Status: revisit | 1,896 Posts
Hello all...

The price is now squashed so tightly between 2 trend lines from Daily Chart (see red circle below). I would like to see a breakout point (downside) anytime within this/next week as EU will make it full retracement from high of Dec 18 2008. We'll see if that happen or not

Any comment is most welcome.

HAVE A LOOK AND MAKE YOUR OWN THOUGHT
Attached Image (click to enlarge)
Click to Enlarge

Name: Presentation1.gif
Size: 127 KB
 
 
  • Post #18,585
  • Quote
  • Edited 7:12am Feb 2, 2009 6:09am | Edited 7:12am
  •  mr.krai
  • | Membership Revoked | Joined Aug 2008 | 71 Posts
candle doji double bottom and support trendline stopss 1.2700 entry 1.2725 macd rb target 8ema
Attached Image (click to enlarge)
Click to Enlarge

Name: 4h1.gif
Size: 30 KB
{Promotion Removed}
 
 
  • Post #18,586
  • Quote
  • Feb 2, 2009 6:33am Feb 2, 2009 6:33am
  •  orangeRANGE
  • | Joined Dec 2008 | Status: revisit | 1,896 Posts
Quoting mr.krai
Disliked
candle doji double top and support trendline stopss 1.2700 entry 1.2725 macd rb target 8ema
Ignored
Brave call mr.krai...

But...I wonder this candlesticks pattern (in red box) would be a MORNING DOJI STAR when the recent candle is closed?

Plus, the macd doesn't look like a perfect rb yet to me. Also, those 2 trend lines are somewhat very tricky level at this moment.

A possible CT but still have to wait though....

HAVE A LOOK AND MAKE YOUR OWN THOUGHT
Attached Image (click to enlarge)
Click to Enlarge

Name: Presentation1.gif
Size: 50 KB
 
 
  • Post #18,587
  • Quote
  • Feb 2, 2009 8:58am Feb 2, 2009 8:58am
  •  mappollo69
  • | Joined Jul 2006 | Status: Member | 138 Posts
I have to say I am liking the method. I am seeing alot better results trading the longer timeframes, I still like to scalp off the 5 and 15m charts but my bigger profits are 4hr timeframe. My confidence has improved dramatically which is paramont.

I have added the QQE indicator to this method with levels 40,50,60.
I look for S&R for entrys & exits with MACD & QQE confirming.


Since london open I have made over 600 pips.
Close of next 4hr bar in 2 minutes, lets see what I will do.
 
 
  • Post #18,588
  • Quote
  • Feb 2, 2009 9:10am Feb 2, 2009 9:10am
  •  Palmer
  • | Joined Apr 2005 | Status: Cruising The Outer Rim... | 2,175 Posts
I agree, nice entry for a quick return to the 8. Keep that stop tight though, I'm just thinking of another leg down from here per the charts setting up. Lot's of support to get through though, in agreement with you oRange...
 
 
  • Post #18,589
  • Quote
  • Feb 2, 2009 10:49am Feb 2, 2009 10:49am
  •  forexpilot69
  • | Joined Jan 2009 | Status: Member | 17 Posts
Thanks for the share. Although I have to learn it a bit longer.hehehe...
 
 
  • Post #18,590
  • Quote
  • Feb 2, 2009 2:30pm Feb 2, 2009 2:30pm
  •  Palmer
  • | Joined Apr 2005 | Status: Cruising The Outer Rim... | 2,175 Posts
Watching for a probable short here...
Attached Image
 
 
  • Post #18,591
  • Quote
  • Feb 2, 2009 2:50pm Feb 2, 2009 2:50pm
  •  Price Motion
  • | Joined Dec 2008 | Status: Member | 9 Posts
hi palmer, i took this u/j trade and was wondering where did i go wrong? It wa a tail which closes below the 89 sma. thanks
Attached Image (click to enlarge)
Click to Enlarge

Name: 2.gif
Size: 20 KB
"Flow with the market rhythm and the pips will come to you."
 
 
  • Post #18,592
  • Quote
  • Feb 2, 2009 3:14pm Feb 2, 2009 3:14pm
  •  Palmer
  • | Joined Apr 2005 | Status: Cruising The Outer Rim... | 2,175 Posts
PM:

That's a tough chart. The 8/21/89 moving averages are right on top of each other and within the same candle. I don't see any good rhythm with this chart right now, even the daily has stalled. I like for the 8/21 to be in harmony with the price action; they are both flowing the same with each other. Take a look at the highlighted area here. This is where I like to look for entries. This pair has looked too erratic for me to consider. If the pair has no flow, I'll simply wait for things to get going again which can take several days to get going....
Attached Image (click to enlarge)
Click to Enlarge

Name: jp.gif
Size: 18 KB
 
 
  • Post #18,593
  • Quote
  • Feb 2, 2009 4:30pm Feb 2, 2009 4:30pm
  •  Pipmaniac
  • | Joined Jan 2008 | Status: Be behind the breakout | 42 Posts
Quoting Palmer
Disliked
Watching for a probable short here...
Ignored
I am not sure about this possible TC,on the daily I see two TLs which act as R in that case. The last one TC ,was a nice one at 29.01.09 16:00. Everything was at the right place,the MA and the emotion candle also. If that situation will develop to a TC I will probably miss it,SL is even now too big for my trading plan. So I wish you happy pipping.
Attached Image (click to enlarge)
Click to Enlarge

Name: 025.jpg
Size: 153 KB
 
 
  • Post #18,594
  • Quote
  • Feb 2, 2009 4:37pm Feb 2, 2009 4:37pm
  •  welshguy2000
  • | Commercial Member | Joined Aug 2007 | 474 Posts
Quoting Price Motion
Disliked
hi palmer, i took this u/j trade and was wondering where did i go wrong? It wa a tail which closes below the 89 sma. thanks
Ignored
I'm sure Palmer will not mind me answering this one for you. Basically you have jumped the gun slightly. You entered when momentum was low & during a point of consolidation. A key indicator for identifying this are the EMA's - when they are angled & have a clear separation, this is the time to take the trades on.

Also one thing - look at the candle pattern which had just happened. You almost have a bullish piercing pattern.

One last thing, you've also entered into the middle of the triangle which you have drawn, as you can see you would have a better entry an hour later.

Cheers WG
 
 
  • Post #18,595
  • Quote
  • Feb 2, 2009 6:36pm Feb 2, 2009 6:36pm
  •  Palmer
  • | Joined Apr 2005 | Status: Cruising The Outer Rim... | 2,175 Posts
Quoting Pipmaniac
Disliked
I am not sure about this possible TC,on the daily I see two TLs which act as R in that case. The last one TC ,was a nice one at 29.01.09 16:00. Everything was at the right place,the MA and the emotion candle also. If that situation will develop to a TC I will probably miss it,SL is even now too big for my trading plan. So I wish you happy pipping.
Ignored
Pipmaniac:

I agree with you about the resistance and the trendlines. I have those on my daily as well ( 2 of them ) but they are around the 2750 area so there might be a change to at least revisit that area. The 4hr closed below the 23.6 Fib # and with price retreating from the 21 that was a signal for me for a TC. I started to check on the 1hr. The entry (white vertical line) was after the MACD turned back to red from previously being green. I got in with a limit order at 2832 looking for a pullback. That MACD bar ended up green but things seem to be moving down again. I exited one for about 20 pips just a short time ago and will move the stop down accordingly. Again, those are hard R areas on the daily and there might be a bounce back up from there. I'm just looking to get back down 'there' which is about 60 pips away....we'll see how this plays out.
Attached Image (click to enlarge)
Click to Enlarge

Name: 1hr.gif
Size: 21 KB
Attached Images
 
 
  • Post #18,596
  • Quote
  • Feb 2, 2009 8:15pm Feb 2, 2009 8:15pm
  •  Palmer
  • | Joined Apr 2005 | Status: Cruising The Outer Rim... | 2,175 Posts
out at b/e after exiting the first lot....
 
 
  • Post #18,597
  • Quote
  • Feb 2, 2009 9:25pm Feb 2, 2009 9:25pm
  •  time1300
  • | Joined Nov 2008 | Status: Keeping Life Simple | 292 Posts
I agree with you guys as well. I am just a little cautious and I will tell you what I see. On the daily you can see the move down from the two spinners down to the trend line is a move of about 600 pips. Usually there is a clear trend either to the short or long side, the trend moves in waves (elliott wave theory). What I have noticed and researched about these moves and back tested my findings is that when there is move in waves, the retracement is usually 50% of the original move which in this situation would be retracement of about 300 pips before and if it continues to go down to test the trend lines again.

So we might see a little bit more of a retracement up to maybe close to the 21ema on the Daily before and if we get another move down to the trend lines. And when and if the trend continues, the down move would be twice as big as the retracement so if the retracement was 200 pips for example, the next wave in the trend would be about 400 or more pips.

Anyone want to add, please do?
Attached Image (click to enlarge)
Click to Enlarge

Name: daily eurusd.gif
Size: 47 KB
Keeping Life Simple
 
 
  • Post #18,598
  • Quote
  • Feb 2, 2009 11:59pm Feb 2, 2009 11:59pm
  •  orangeRANGE
  • | Joined Dec 2008 | Status: revisit | 1,896 Posts
Hi all...

Below is Eu h4 and h1 chart with the same period of time. I have marked some points at both charts which maybe we should have pay attention here.

HAVE A LOOK AND MAKE YOUR OWN THOUGHT
Attached Image(s) (click to enlarge)
Click to Enlarge

Name: Presentation1.gif
Size: 111 KB
Click to Enlarge

Name: Presentation2.gif
Size: 131 KB
 
 
  • Post #18,599
  • Quote
  • Feb 3, 2009 12:45am Feb 3, 2009 12:45am
  •  time1300
  • | Joined Nov 2008 | Status: Keeping Life Simple | 292 Posts
I would have to agree with you Orange, I also have the 1.3050 area as I think we might see a retracement to that level before heading lower.

I am long after the 4:00 candle on the 4H chart as it closed above 21ema.
Price on the Daily has tested a major trend line dating back from Nov. 08. MACD formed a round bottom off of the trend line and when price closed above the 21ema I decided to go long. Also the last down move has been about 600 pips and when there are waves, then the retracement is about half of the move thus I think price will retrace before and if it will continue down. The 4 hour candle was a big one so I set limit orders for 3 stage entry to minimize stop loss.

My target is just under the 1.3050.
Keeping Life Simple
 
 
  • Post #18,600
  • Quote
  • Feb 3, 2009 1:07am Feb 3, 2009 1:07am
  •  fxnoob08
  • | Joined Jan 2009 | Status: Member | 93 Posts
on what page can i find the e-book of summary regarding the latest update to this method. i dont want to run the risk of downloading something thats not up to date. and this thread is 1200+ pages
 
 
  • Commercial Content
  • /
  • 4 Hour Strategy (MACD)
  • Reply to Thread
    • 1 928929Page 930931932 1579
    • 1 Page 930 1579
2 traders viewing now, 1 is a member:
andreas73
  • More
Top of Page
  • Facebook
  • Twitter
About FF
  • Mission
  • Products
  • User Guide
  • Media Kit
  • Blog
  • Contact
FF Products
  • Forums
  • Trades
  • Calendar
  • News
  • Market
  • Brokers
  • Trade Explorer
FF Website
  • Homepage
  • Search
  • Members
  • Report a Bug
Follow FF
  • Facebook
  • Twitter

FF Sister Sites:

  • Metals Mine
  • Energy EXCH
  • Crypto Craft

Forex Factory® is a brand of Fair Economy, Inc.

Terms of Service / ©2023