Thanks K40. Amongst my winners, I have had only one loss, which
was $2.00, and three breakevens. I find that, even with a failed
breakout, I get enough action out of the first breakout candle to at
least get in a decent stop. I want to keep it tight, since I'm not
interested in watching price fluctuate for several bars - it either
fails and hits my stop, or it breaks out.
The one thing that makes it difficult for me is the spread. I
only track four pairs, since IBFX has jacked around the spreads
to the point of absurdity. I'm with them only...
Ignored
I used IBFX before, so I know what you are talking about. I use AMP's Ninja platform. Their spread is also high, but I do like Ninj.
Again I am glad that you are doing well.
Takes some getting used to. I don't understand where to start a trendline from. How far back? Is it subjective, where person A sees it one way, person B another, and person C another? Or is there a way to know?
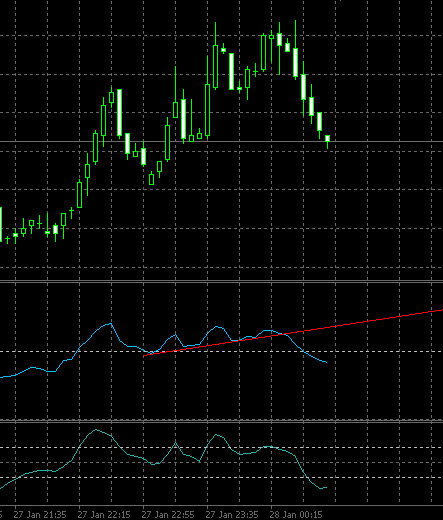
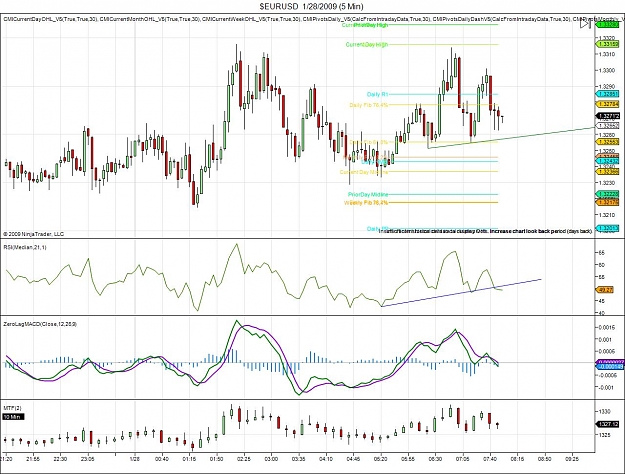
here's a chart with two RSI windows. One that I have lines at 75/25, and the second window where I drew in my own red lines to show a channel where the EUR hasn't really exceeded in some time at 67.4 and 34.8 (Almost like fib lines). I took the short trade when it hit the 67.4 line & we'll see what happens. Am I on the right track?
Takes some getting used to. I don't understand where to start a trendline from. How far back? Is it subjective, where person A sees it one way, person B another, and person C another? Or is there a way to know?
Ignored
I look at the most recent high/low, the swing. Your trend lines seem to be too long. Again this is good for short term counter trend, and its good for 20-40 pips. Of course sometimes it runs and give you lots more.
Just go over the posted charts again.
Thanks for the feed back
Takes some getting used to. I don't understand where to start a trendline from. How far back? Is it subjective, where person A sees it one way, person B another, and person C another? Or is there a way to know?
Ignored
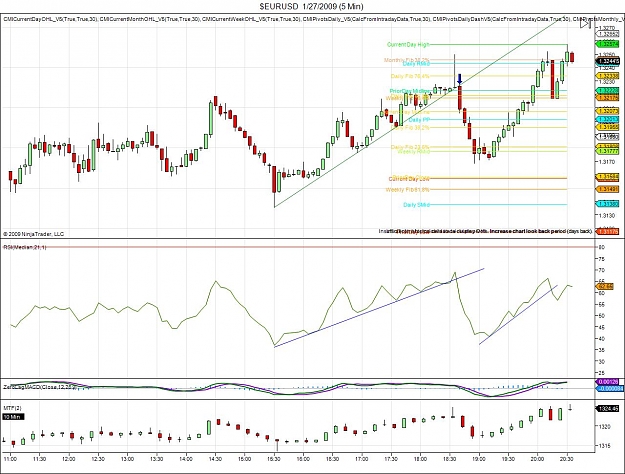
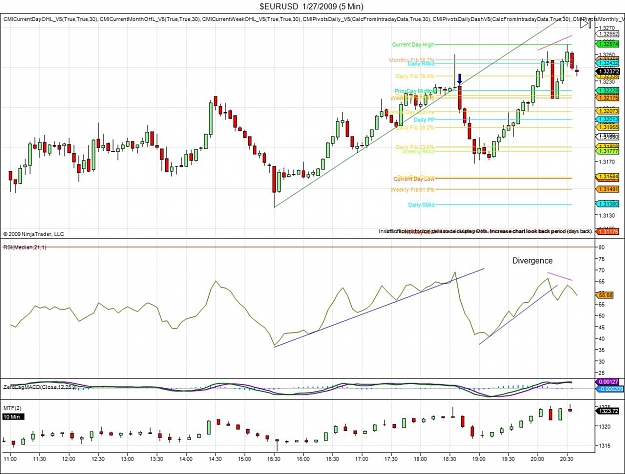
Here is a recent example. Again expand your charts and start with the most recent change( low or high)
Interesting...scrolled back on my chart and see that the EUR/USD hasn't exceeded 75/25 for days, and almost immediately when it hits those marks, it reverses. On that trade I made, I made 10 (got stopped out, but it went as much as almost 30 pips in my favor). Looks like all someone has to to is wait for it to hit 75 or 25, or even a little less at 65/35 & simply wait for the reversal? Can't be that easy, though. What am I not considering?
Interesting...scrolled back on my chart and see that the EUR/USD hasn't exceeded 75/25 for days, and almost immediately when it hits those marks, it reverses. On that trade I made, I made 10 (got stopped out, but it went as much as almost 30 pips in my favor). Looks like all someone has to to is wait for it to hit 75 or 25, or even a little less at 65/35 & simply wait for the reversal? Can't be that easy, though. What am I not considering?
Ignored
I put 20/80 on my charts, but still trade mostly the trend line break. In trending markets it can stay high/low for a while. This set up works, just keep a 20 pip stop loss and move it to break even at 10 pip profit. Its a good set up, because its simple. Just try it for a couple of days. Of course no news trading. Nothing works there!
Yes, I was aware that the RSI is traditionally used as an 80/20 fror overbought and oversold. Just lokked like the EUR was in some sort of zone at about 65/35. Probably temporary, but was looked like that sort of thing could be capitalized on while it lasted. For the life of me, I can't get this trend pattern thing. I'll figure it out if it takes me a year. Maybe you just have to get close, and no three people will draw the same lines.
Ignored
This is a short-term strategy, so just grab some recent swing-high/swing-
low points and connect them with your trendline. Look for downward angle
on the peaks, for your long breakout, and a upward angle on the peaks,
with a trendline on the bottoms, for your short breakout. When I see consolidation, I draw trendines on tops and bottoms, since it could break
either way.
After you've looked at a bunch of charts, it'll all start to come together.
For me, the hardest part is managing the trade. It's certainly the most
stressful part of the experience.
Good luck with your efforts. Post back with some of your practice trades.
This is a short-term strategy, so just grab some recent swing-high/swing-
low points and connect them with your trendline. Look for downward angle
on the peaks, for your long breakout, and a upward angle on the peaks,
with a trendline on the bottoms, for your short breakout. When I see consolidation, I draw trendines on tops and bottoms, since it could break
either way.
After you've looked at a bunch of charts, it'll all start to come together.
For me, the hardest part is managing the trade. It's certainly the most
stressful part of the experience....
Yes, I was aware that the RSI is traditionally used as an 80/20 fror overbought and oversold. Just lokked like the EUR was in some sort of zone at about 65/35. Probably temporary, but was looked like that sort of thing could be capitalized on while it lasted. For the life of me, I can't get this trend pattern thing. I'll figure it out if it takes me a year. Maybe you just have to get close, and no three people will draw the same lines.
Ignored
Interesting idea Paradoxical. I will look into it.
Thanks for the post.
Not seeing much with the four pairs I monitor. Price action is
mostly sideways with small candles. I may draw upper and lower
trendlines on these and see if there will be any breakouts.