DislikedRegarding your first picture.
Wouldn't it be the same if you just trade a normal
trendline break on your chart?Ignored
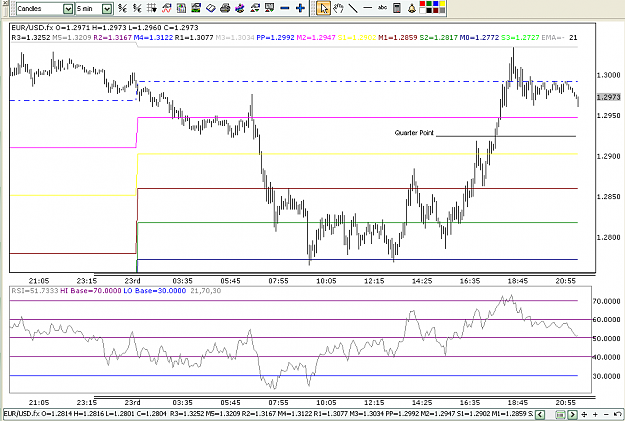
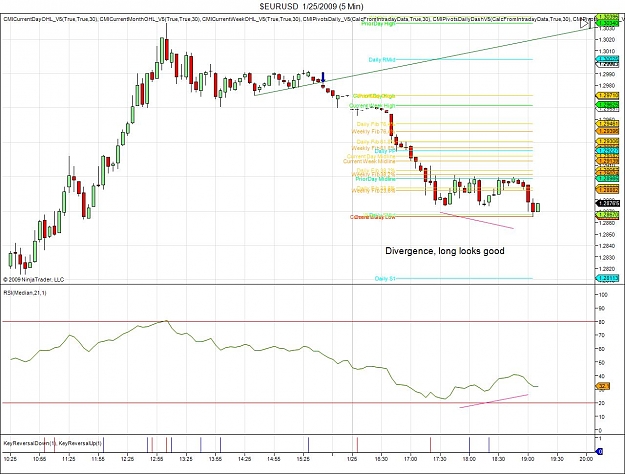
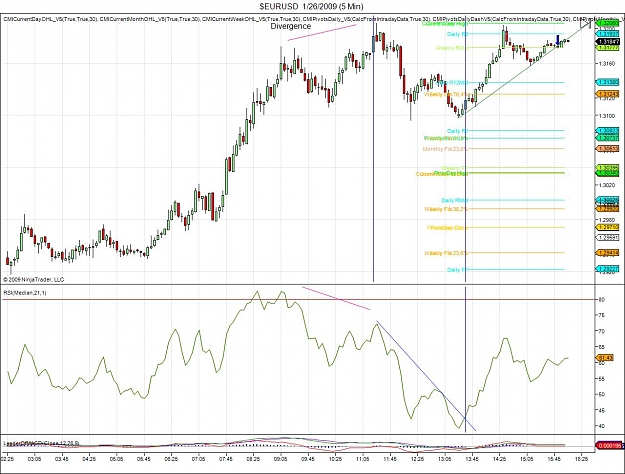
Utilizing normail trend lines as well as pivot points ... will give you a better view of price action direction and use RSI(21) to confirm that direction. Using RSI levels 30-70 and applying pivots, support & resistance, trend lines ... you can see or expect price action direction on the chart and on the RSI indicator.
Blue dotted line is our pivot point and the colored lines are our support and resistance levels, obtained daily using the pivot point formula. Here are a couple of notices:
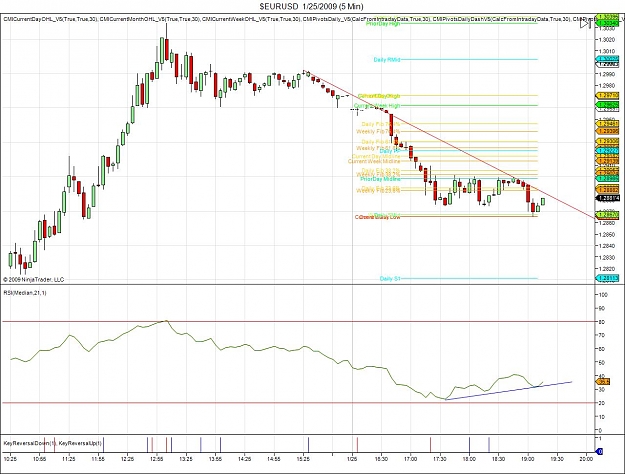
- Price action breaking or bouncing off S/R & pivot levels
- RSI(21) shown breaking or bouncing off the next whole level
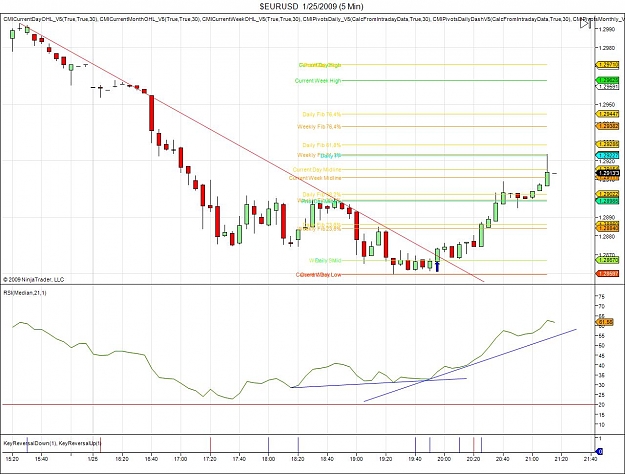
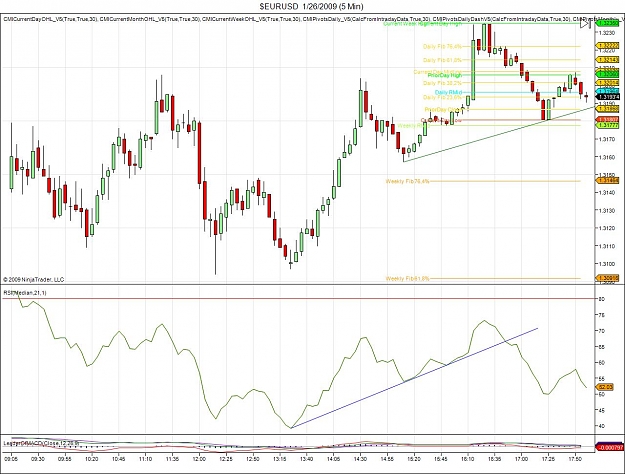
For example: take P/A move just before the time of 14:25. P/A sits on a purple S/R level, RSI sits on the 40 level. P/A rises and breakthough green S/R level and stops at the brown S/R level. At the same time, RSI moves up off the 40 level, breaksthrough the 50 level and stops at the 60 level. It did just the same as price action.
Now im not saying this method is perfect, because it is not. The point im trying to make is, by using the RSI and Pivot Point/Support Resistance level, can give a trader entry, direction, target, and trading goal.
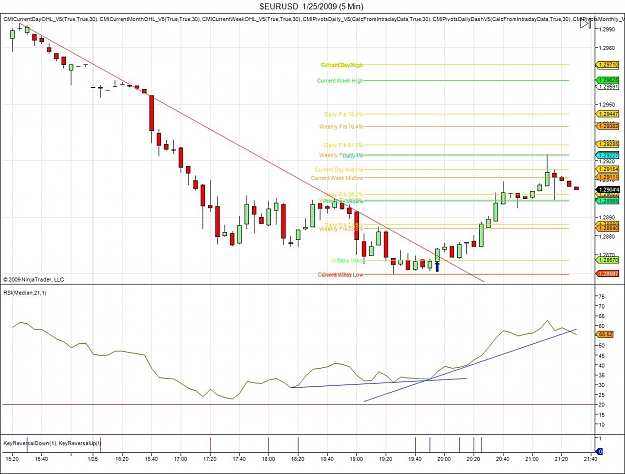
Also, on a quick note, consider using Quarter Points within your S/R levels. Quarter Points are the middle point of an S/R level.
Attached Image (click to enlarge)