The RSI
This set up is based on an article written in Technical Analysis of Stocks and Commodities. The article was written by Hadi Seyedinajad. Mr. Seyedinajad uses the RSI mostly for exits, but I found it to work well for trade entries. I use the RSI for counter trend and trend following trade entries as well. I have been trading this set up for the past four weeks with good results, even in these choppy markets. The rules are very simple and all you need is the RSI on a 5 minute chart. I only day trade the EUR/USD with this set up. I do chart and watch the Fibs and major Support and Resistance.
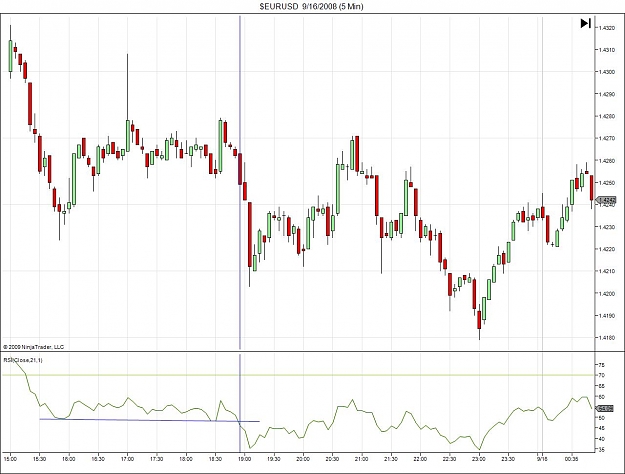
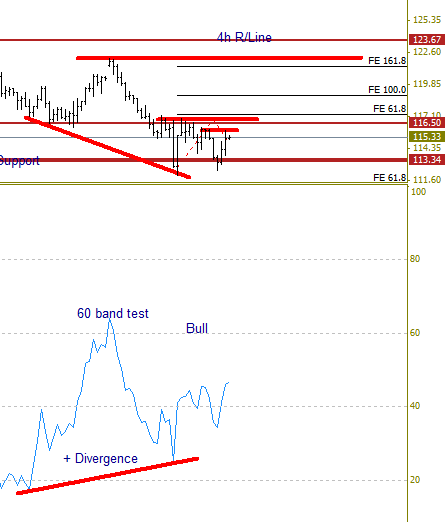
The set works very well when at price consolidation. It can give an early indication of the direction of the break out.
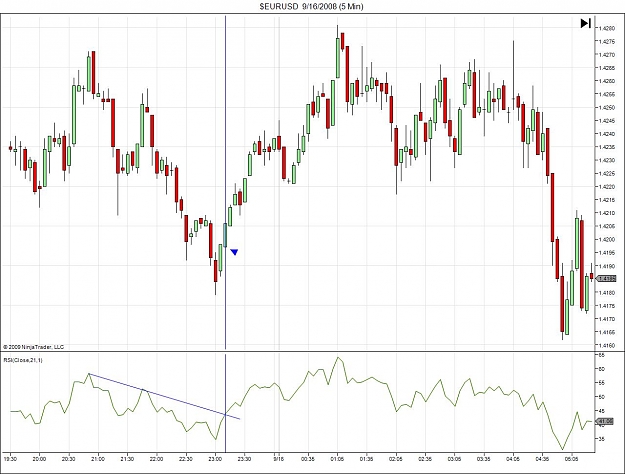
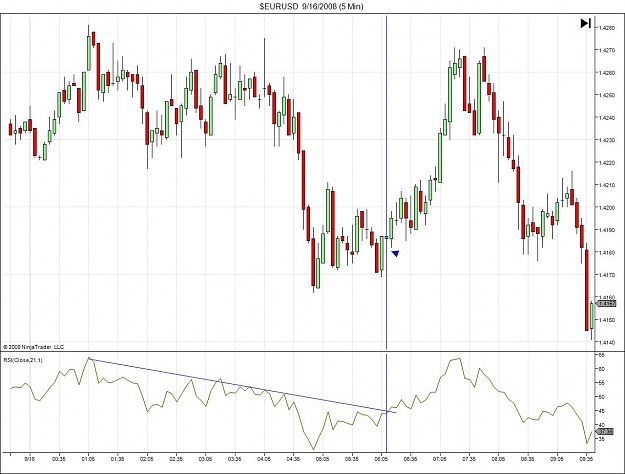
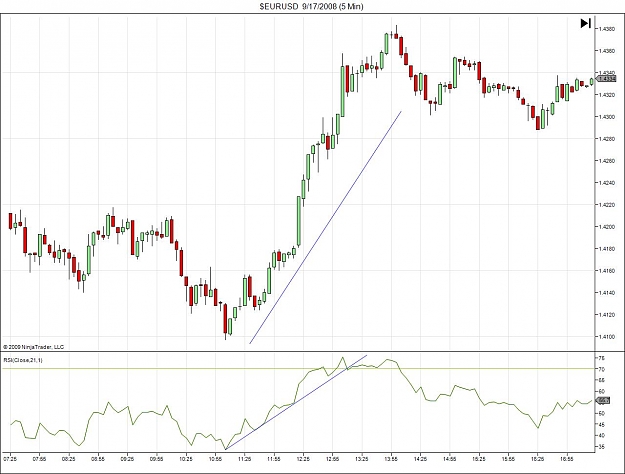
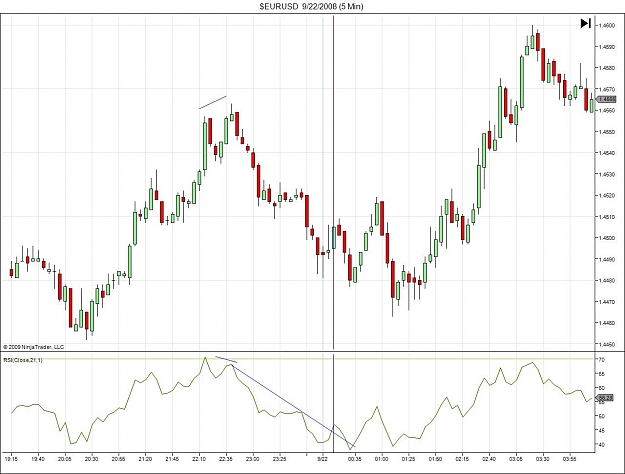
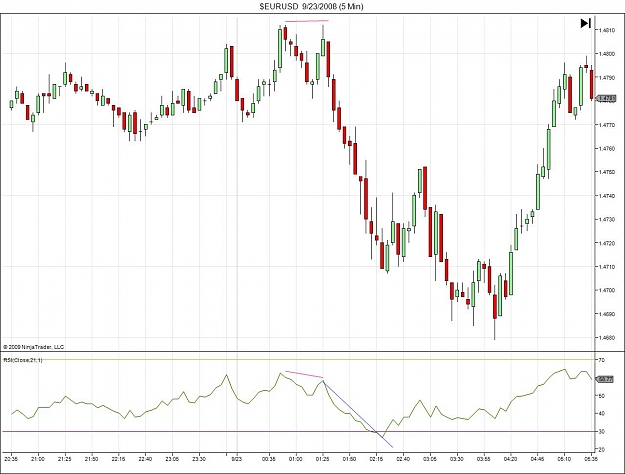
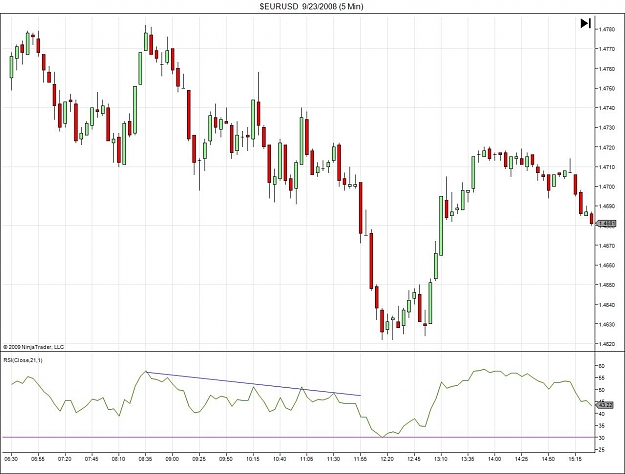
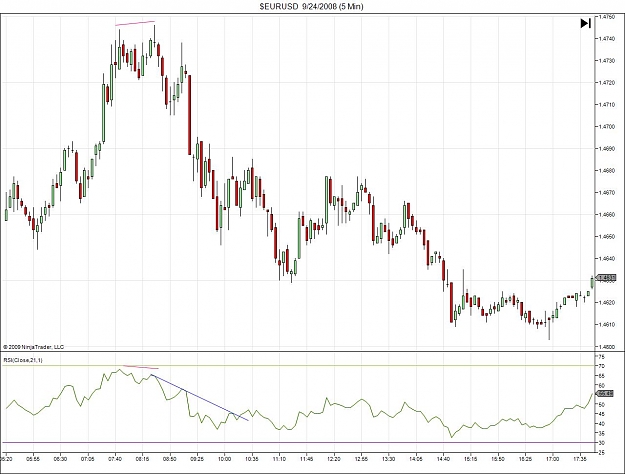
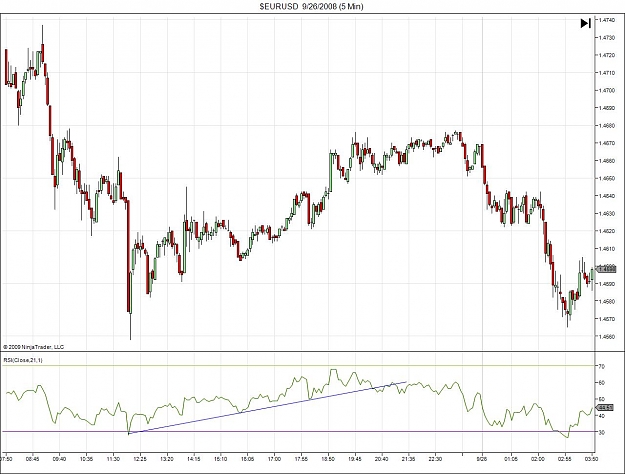
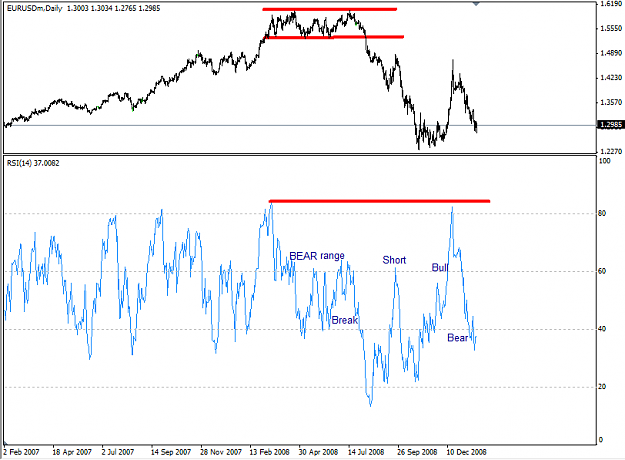
I use the RSI to make my trades entries. Draw a trend line on the RSI, from the most recent high (or low) and wait for the break to enter as a counter trend. I also use the RSI as a trend following entries. When the RSI bounces off the trend line, I can enter the trade. The key here is to see the long term chart to determine the best use of the RSI, trend or counter trend.
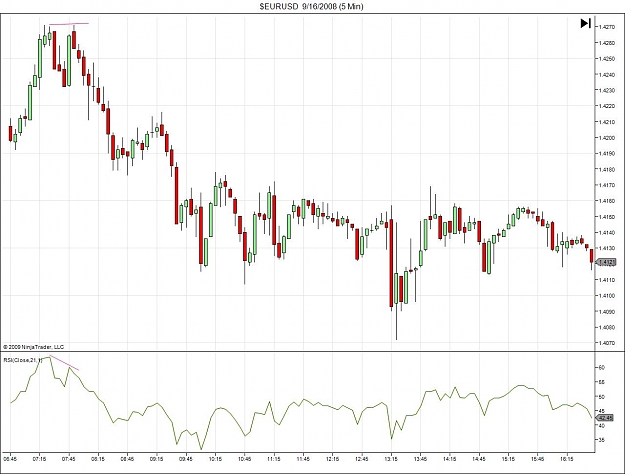
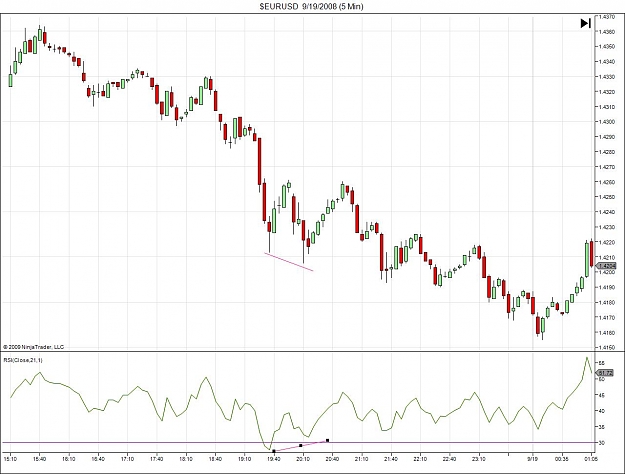
Of course as most of us know, the RSI divergence can be a great trade as well, so do watch for divergences.
In later post I will show the use of Fibs and the micro trend use as well.
Again the set up is very simple:
This set up is based on an article written in Technical Analysis of Stocks and Commodities. The article was written by Hadi Seyedinajad. Mr. Seyedinajad uses the RSI mostly for exits, but I found it to work well for trade entries. I use the RSI for counter trend and trend following trade entries as well. I have been trading this set up for the past four weeks with good results, even in these choppy markets. The rules are very simple and all you need is the RSI on a 5 minute chart. I only day trade the EUR/USD with this set up. I do chart and watch the Fibs and major Support and Resistance.
The set works very well when at price consolidation. It can give an early indication of the direction of the break out.
I use the RSI to make my trades entries. Draw a trend line on the RSI, from the most recent high (or low) and wait for the break to enter as a counter trend. I also use the RSI as a trend following entries. When the RSI bounces off the trend line, I can enter the trade. The key here is to see the long term chart to determine the best use of the RSI, trend or counter trend.
Of course as most of us know, the RSI divergence can be a great trade as well, so do watch for divergences.
In later post I will show the use of Fibs and the micro trend use as well.
Again the set up is very simple:
- EUR/USD only
- 5 minute chart
- 21 period RSI
- Enter/exit based on RSI Trend lines
- 20 Pips for stop loss and trailing stop for profit target.
- Move the stop to break even as soon as you have 10 pips and keep trailing. I have used the 25 trail stop.
- Don’t trade this set up ( or any set up!!) during major news
- Don’t widen or remove your stop.
Okay, here are some examples:
(This is my first post and I could not post the explanation next to the pictures. This is the only way I could this work. I hope it make sense)
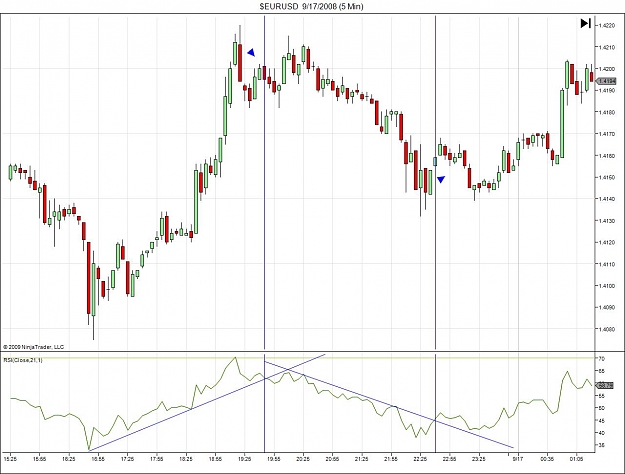
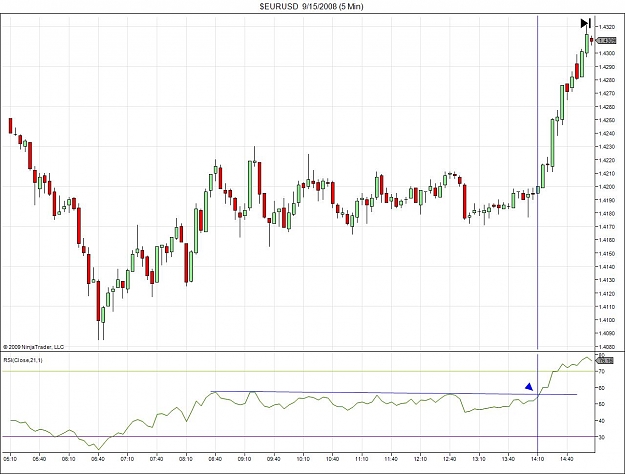
- This is an example of consolidation market. The RSI gives early indication of the breakout.
Attached Image (click to enlarge)
Trade Garlic