Chronics of the recent days (the day price graph)
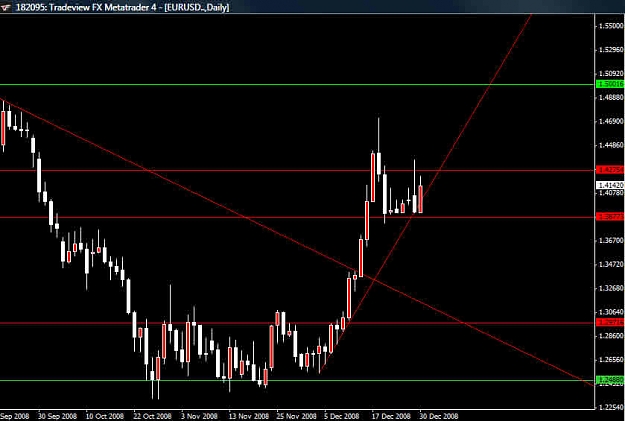
At the end of December the pair unexpectedly gave “a Christmas present” to all market participants by easily overcoming mark 1.30 USD, then 1.40 USD and, finally, setting a maximum above 1.47, and then it returned to level 1.40 none the less easily. Now many market participants are scratching their heads and trying to understand what will happen next. The most cautious ones will surely prefer waiting two or three weeks after New Year before making up their minds with investment. Not in the least adopting a role of a “guru”, let us endeavor to project different variants of the situation development, having armed with the classic technical analysis tools and Elliott wave theory.
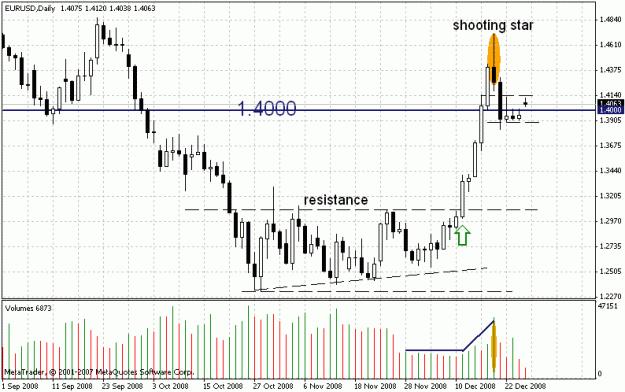
The fact that the volume began growing after the break of an important resistance level confirmed the trend further continuation. And those market participants who took this postulate of Dow Theory into account and opened a buying position, were rewarded by the market properly. However, then a shooting star reverse candle model together with the large volume gave a signal about the trend change, which we could observe later. The price returned to psychological level 1.40, after that Christmas holidays came.
And what does the wave analysis say?
Now let us reduce the graph resolution and consider the situation from the point of view of the wave principle.
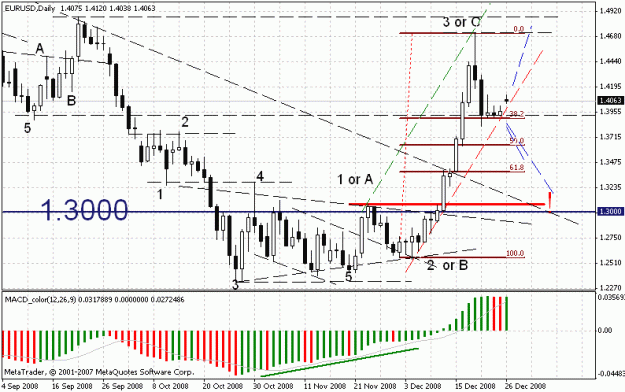
The fact that the descending movement ending accompanied with “bull” divergence of MACD histogram with the price, enabled to make a conclusion about the fifth wave formation—according to the wave principle, it is the very case when divergences with price are formed in the oscillators most frequently. By pushing off from such a position, it is possible to compile two alternative scenarios:
The most difficult challenge to be done first of all is to recognize the beginning of the first wave, the so called zero point. Experience shows the following moments as good confirmation – the price bounced from an important support level several times, bull divergence with the price was formed in the oscillator before the ascending movement. And although the second wave is deep correction, it could not return to the beginning of the first wave.
Now let us recollect individual features of each wave.
Wave 1. Almost a half ofall the first waves emerge at the market base and are nothing different but “bounces” from the lowest levels. The first wave, as a rule, is the shortest one out of the five waves, most of the market participants do not believe in a new trend and are reluctant to open long-term positions yet—it passes.
Wave 2.As a rule, wave 2 passes the distance passed by the first wave entirely or almost entirely, but stops over the level of the first wave base. It is possible to adopt 61.8 % Fibonacci level as a guide. Movement of wave 1 encounters strong resistance of bears, who still believe in the down-trend preservation and regard the first wave as a mere chance. Note that the second wave ending has failed to return to the support level, and a football saying works well here—if you do not score a goal, a goal will be scored to you—it passes.
Wave 3. As a rule, it isthe longest and most dynamic of all the impulse waves. Crossing of the first wave top by the third wave registers all types of classic breaks and a signal to open long positions. Sharp rise of the trade volumes falls to this wave. Wave 3 can never be the shortest of the impulse waves. The slope angle is frequently steeper than the same of the first wave. Elliott waves can be discerned most surely during the third wave formation. And it is the third wave that gives the best opportunities for profit gaining— it passes.
Note how slowly the third wave rise began and finally reached the top of the previous rise (the ending of wave 1). In this time, over the first level top, many stop signals were set, after working of which the ascending movement accelerated, as many traders began hastily closing selling positions and opening buying positions. The situation is marked with the green oval in the graph.
The third wave ending was marked with a shooting star formation, which I have mentioned above. Now, with the use of the channel technical technique from the wave analysis, let us draw a line through the tops of wave 1 and wave 3—it is marked with green. Then let us draw a parallel line through the end of wave 2—it is marked with red. We will need it to define the potential end of wave 4. By the way, does the target turn out to have been reached? Is there the so called “alternation rule” running that the second wave was deep correction – 61.8% Fibonacci, so wave 4 will not be deep correction – 38.2% Fibonacci? Does everything coincide again?!
Trade tactics
Now, in my personal opinion, it is reasonable to apply the following tactics. In case if the day candle is closed over intermediate resistance 1.4140 (it is marked in the first graph), a buying position should be opened. Stop-loss should be placed inside the current corridor, take-profit – in the area of 1.48. When the price approaches the target, it is required to turn on trailing-stop. In this particular case I think that the movement will proceed within the fifth impulse wave.
In case if an intermediate support is broken and the day candle is closed below level 1.38, open a selling position. Stop-loss should be placed above the day candle maximum, the first target is at Fibonacci level 61.8 1.3480-1.3550, the second target is in the area of 1.3050-1.3150. In this case I think that wave 4 is deeper correction. According to the wave theory, the critical level is the top of the first wave, break of which will make us review the situation and consider the conclusions about the laying of the waves made before wrong. However, basing on practical experience, I recommend regarding barrier 1.3000 as the critical level, and the day, and even better, the week candle closing below the level, will allow making the conclusion that before we were in A-B-C correction, and not in an impulse, and that the descending movement is gaining pace.
Note that both the first and the second development scenarios enable to make some money. The advantage of the wave analysis application consists in the feature that its rules are not cast out of concrete, but, on the contrary, flexible and natural, allowing converting the mistake made into benefit.
Dear reader, I will be glad to know your opinion
Have a nice day! Alex Sabodin.
At the end of December the pair unexpectedly gave “a Christmas present” to all market participants by easily overcoming mark 1.30 USD, then 1.40 USD and, finally, setting a maximum above 1.47, and then it returned to level 1.40 none the less easily. Now many market participants are scratching their heads and trying to understand what will happen next. The most cautious ones will surely prefer waiting two or three weeks after New Year before making up their minds with investment. Not in the least adopting a role of a “guru”, let us endeavor to project different variants of the situation development, having armed with the classic technical analysis tools and Elliott wave theory.
Attached Image (click to enlarge)
The fact that the volume began growing after the break of an important resistance level confirmed the trend further continuation. And those market participants who took this postulate of Dow Theory into account and opened a buying position, were rewarded by the market properly. However, then a shooting star reverse candle model together with the large volume gave a signal about the trend change, which we could observe later. The price returned to psychological level 1.40, after that Christmas holidays came.
And what does the wave analysis say?
Now let us reduce the graph resolution and consider the situation from the point of view of the wave principle.
The fact that the descending movement ending accompanied with “bull” divergence of MACD histogram with the price, enabled to make a conclusion about the fifth wave formation—according to the wave principle, it is the very case when divergences with price are formed in the oscillators most frequently. By pushing off from such a position, it is possible to compile two alternative scenarios:
- We are in the forth wave of the impulse.
- We are in wave C of correction.
Attached Image (click to enlarge) 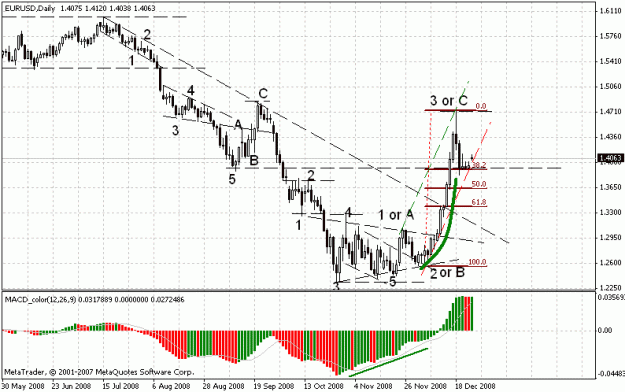
Let us begin with the first variant.
The most difficult challenge to be done first of all is to recognize the beginning of the first wave, the so called zero point. Experience shows the following moments as good confirmation – the price bounced from an important support level several times, bull divergence with the price was formed in the oscillator before the ascending movement. And although the second wave is deep correction, it could not return to the beginning of the first wave.
Now let us recollect individual features of each wave.
Wave 1. Almost a half ofall the first waves emerge at the market base and are nothing different but “bounces” from the lowest levels. The first wave, as a rule, is the shortest one out of the five waves, most of the market participants do not believe in a new trend and are reluctant to open long-term positions yet—it passes.
Wave 2.As a rule, wave 2 passes the distance passed by the first wave entirely or almost entirely, but stops over the level of the first wave base. It is possible to adopt 61.8 % Fibonacci level as a guide. Movement of wave 1 encounters strong resistance of bears, who still believe in the down-trend preservation and regard the first wave as a mere chance. Note that the second wave ending has failed to return to the support level, and a football saying works well here—if you do not score a goal, a goal will be scored to you—it passes.
Wave 3. As a rule, it isthe longest and most dynamic of all the impulse waves. Crossing of the first wave top by the third wave registers all types of classic breaks and a signal to open long positions. Sharp rise of the trade volumes falls to this wave. Wave 3 can never be the shortest of the impulse waves. The slope angle is frequently steeper than the same of the first wave. Elliott waves can be discerned most surely during the third wave formation. And it is the third wave that gives the best opportunities for profit gaining— it passes.
Note how slowly the third wave rise began and finally reached the top of the previous rise (the ending of wave 1). In this time, over the first level top, many stop signals were set, after working of which the ascending movement accelerated, as many traders began hastily closing selling positions and opening buying positions. The situation is marked with the green oval in the graph.
The third wave ending was marked with a shooting star formation, which I have mentioned above. Now, with the use of the channel technical technique from the wave analysis, let us draw a line through the tops of wave 1 and wave 3—it is marked with green. Then let us draw a parallel line through the end of wave 2—it is marked with red. We will need it to define the potential end of wave 4. By the way, does the target turn out to have been reached? Is there the so called “alternation rule” running that the second wave was deep correction – 61.8% Fibonacci, so wave 4 will not be deep correction – 38.2% Fibonacci? Does everything coincide again?!
Trade tactics
Now, in my personal opinion, it is reasonable to apply the following tactics. In case if the day candle is closed over intermediate resistance 1.4140 (it is marked in the first graph), a buying position should be opened. Stop-loss should be placed inside the current corridor, take-profit – in the area of 1.48. When the price approaches the target, it is required to turn on trailing-stop. In this particular case I think that the movement will proceed within the fifth impulse wave.
Attached Image (click to enlarge)
In case if an intermediate support is broken and the day candle is closed below level 1.38, open a selling position. Stop-loss should be placed above the day candle maximum, the first target is at Fibonacci level 61.8 1.3480-1.3550, the second target is in the area of 1.3050-1.3150. In this case I think that wave 4 is deeper correction. According to the wave theory, the critical level is the top of the first wave, break of which will make us review the situation and consider the conclusions about the laying of the waves made before wrong. However, basing on practical experience, I recommend regarding barrier 1.3000 as the critical level, and the day, and even better, the week candle closing below the level, will allow making the conclusion that before we were in A-B-C correction, and not in an impulse, and that the descending movement is gaining pace.
Note that both the first and the second development scenarios enable to make some money. The advantage of the wave analysis application consists in the feature that its rules are not cast out of concrete, but, on the contrary, flexible and natural, allowing converting the mistake made into benefit.
Dear reader, I will be glad to know your opinion
Have a nice day! Alex Sabodin.